1. 绘制简单图形
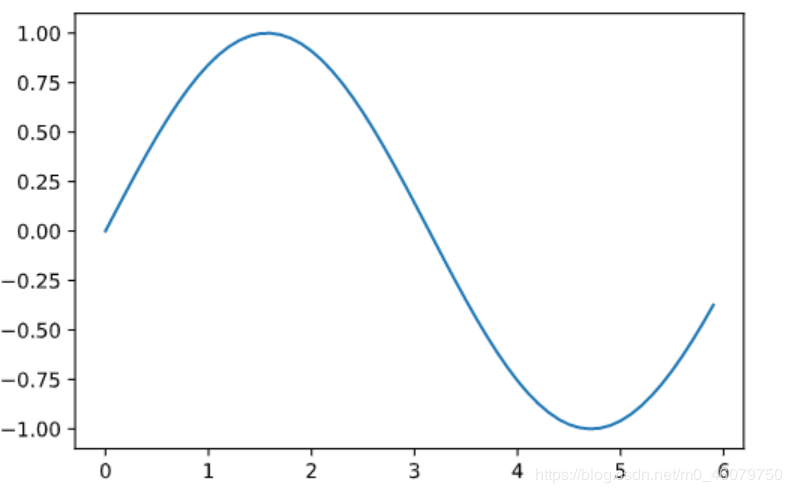
使用 matplotlib 的pyplot模块绘制图形。看一个 绘制sin函数曲线的例子。
|
1
2
3
4
5
6
7
8
9
10
|
import matplotlib.pyplot as plt import numpy as np# 生成数据x = np.arange(0, 6, 0.1) # 以0.1为单位,生成0到 6 的数据*y = np.sin(x)# 绘制图形plt.plot(x,y)plt.show() |

这里使用NumPy的arange()方法生成了[0, 0.1, 0.2, … , 5.8, 5.9]的 数据,将其设为x。
对x的各个元素,应用NumPy的sin函数np.sin(),将x、 y的数据传给plt.plot方法,然后绘制图形。
最后,通过plt.show()显示图形。 运行上述代码后,就会显示如上图所示的图形。
2. pyplot的功能
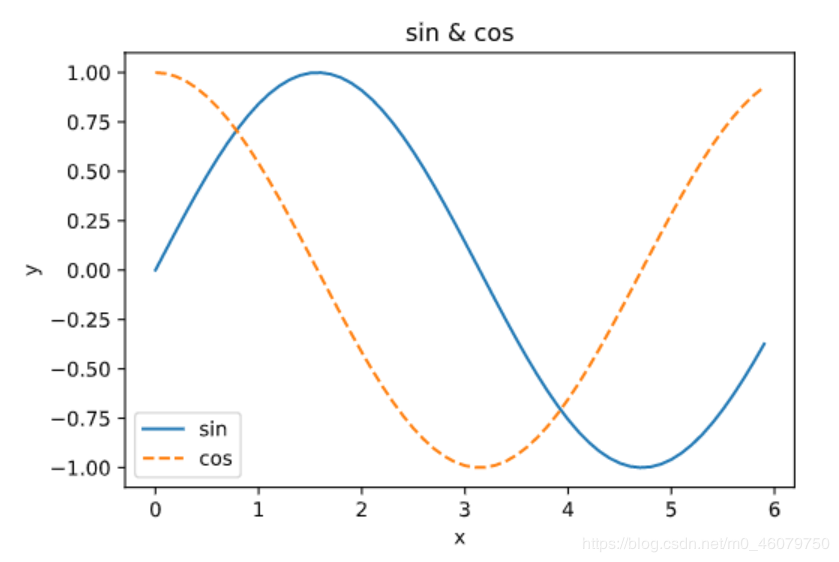
使用 pyplot的添加标题plt.title()、坐标轴标签名plt.xlabel()\ plt.ylabel()和图例plt.legend()。
|
1
2
3
4
5
6
7
8
9
10
11
12
13
14
15
16
17
18
|
import numpy as np import matplotlib.pyplot as plt# 生成数据 x = np.arange(0, 6, 0.1) # 以0.1为单位,生成0到6的数据 y1 = np.sin(x)y2 = np.cos(x)# 绘制图形 plt.plot(x, y1, label="sin") plt.plot(x, y2, linestyle= "--", label="cos") # 用虚线绘制 plt.xlabel("x") # x轴标签 plt.ylabel("y") # y轴标签 plt.title('sin & cos') # 标题 plt.legend() #显示图例plt.show() |

3. 显示图像
pyplot中还提供了用于显示图像的方法imshow()。
使用 matplotlib.image模块的imread()方法读入图像。
|
1
2
3
4
5
6
7
|
import matplotlib.pyplot as plt from matplotlib.image import imreadimg = imread(r'D:\plant\plant_1.jpg') # 读入图像,读者根据自己的环境,变更文件名或文件路径(绝对或相对路径,注意路径名不能出现中文)plt.imshow(img)plt.show() |

到此这篇关于使用matplotlib的pyplot模块绘图的实现示例的文章就介绍到这了,更多相关matplotlib pyplot模块绘图内容请搜索服务器之家以前的文章或继续浏览下面的相关文章希望大家以后多多支持服务器之家!
原文链接:https://blog.csdn.net/m0_46079750/article/details/107243064


