一个最最简单的例子:
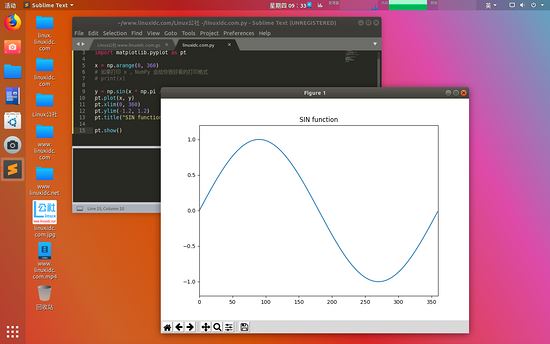
绘制一个从 0 到 360 度完整的 sin 函数图形
|
1
2
3
4
5
6
7
8
9
10
11
|
import numpy as npimport matplotlib.pyplot as ptx = np.arange(0, 360)# 如果打印 x ,numpy 会给你很好看的打印格式# print(x)y = np.sin(x * np.pi / 180)pt.plot(x, y)pt.xlim(0, 360)pt.ylim(-1.2, 1.2)pt.title("sin function")pt.show() |
效果图如下:

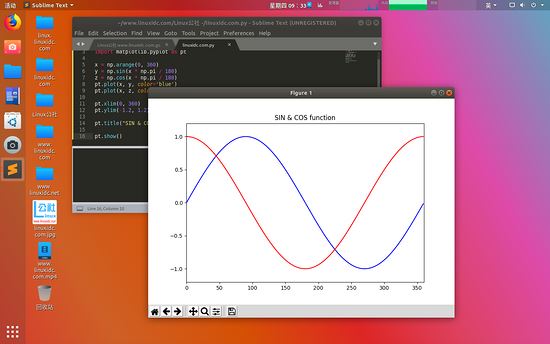
下面我们加上一个 cos 函数图形,并且使用不同的颜色来表示。
|
1
2
3
4
5
6
7
8
9
10
11
|
import numpy as npimport matplotlib.pyplot as ptx = np.arange(0, 360)y = np.sin(x * np.pi / 180)z = np.cos(x * np.pi / 180)pt.plot(x, y, color='blue')pt.plot(x, z, color='red')pt.xlim(0, 360)pt.ylim(-1.2, 1.2)pt.title("sin & cos function")pt.show() |
效果图:

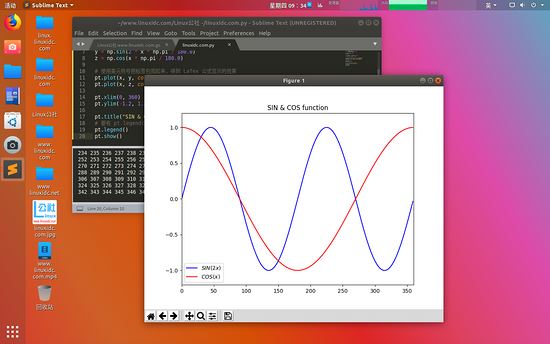
然后,我们加上图例,x 轴的说明和 y 轴的说明。
|
1
2
3
4
5
6
7
8
9
10
11
12
13
14
15
|
import numpy as npimport matplotlib.pyplot as ptx = np.arange(0, 360)print(x)y = np.sin(2 * x * np.pi / 180.0)z = np.cos(x * np.pi / 180.0)# 使用美元符号把标签包围起来,得到 latex 公式显示的效果pt.plot(x, y, color='blue', label="$sin(2x)$")pt.plot(x, z, color='red', label="$cos(x)$")pt.xlim(0, 360)pt.ylim(-1.2, 1.2)pt.title("sin & cos function")# 要有 pt.legend() 这个方法才会显示图例pt.legend()pt.show() |
效果图如下:

总结
以上所述是小编给大家介绍的python3使用matplotlib 绘制精美的数学函数图形,希望对大家有所帮助,如果大家有任何疑问请给我留言,小编会及时回复大家的。在此也非常感谢大家对服务器之家网站的支持!
如果你觉得本文对你有帮助,欢迎转载,烦请注明出处,谢谢!原文链接:https://www.linuxidc.com/Linux/2019-04/158051.htm


