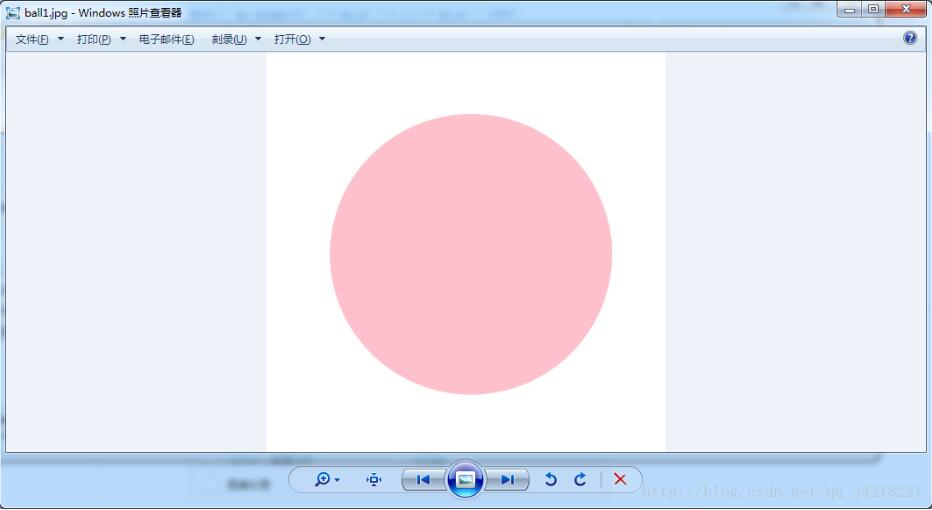
本文实例为大家分享了python实现画圆功能的具体代码,供大家参考,具体内容如下
|
1
2
3
4
5
6
7
8
9
10
11
12
13
14
15
16
17
18
19
20
21
22
23
24
25
26
27
28
29
30
31
32
33
34
35
36
37
|
# -*- coding: utf-8 -*- """ __author__= 'Du' __creation_time__= '2018/1/4 17:30' """ import numpy as np import matplotlib.pyplot as plt # 该行用于设置chart 的样式,可以注掉 # plt.style.use("mystyle") fig = plt.figure(figsize=(8,8)) ax = fig.add_subplot(111) ax.spines['left'].set_color('none') ax.spines['bottom'].set_color('none') ax.spines['right'].set_color('none') ax.spines['top'].set_color('none') ax.set_xticks([]) ax.set_yticks([]) # 实现功能 theta = np.arange(0, 2 * np.pi + 0.1,2 * np.pi / 1000) x = np.cos(theta) y = np.sin(theta) v = np.linspace(0, 10, 100) v.shape = (100, 1) x = v * x y = v * y plt.plot(x, y, color='pink') # plt.savefig('ball1.jpg') plt.show() |
效果图:

以上就是本文的全部内容,希望对大家的学习有所帮助,也希望大家多多支持服务器之家。
原文链接:http://blog.csdn.net/qq_34218221/article/details/78980519


