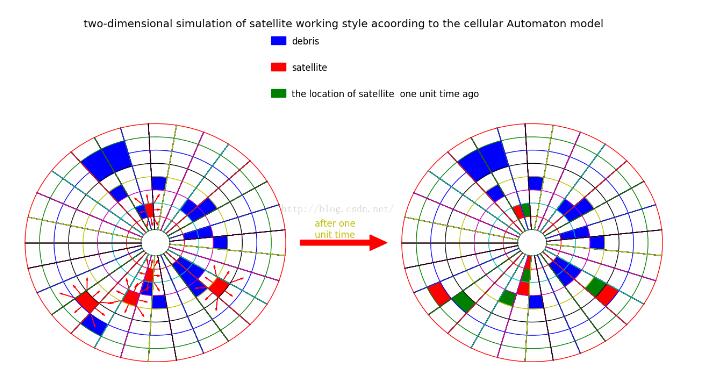
本文实例为大家分享了python实现画圆功能的具体代码,供大家参考,具体内容如下

|
1
2
3
4
5
6
7
8
9
10
11
12
13
14
15
16
17
18
19
20
21
22
23
24
25
26
27
28
29
30
31
32
33
34
35
36
37
38
39
40
41
42
43
44
45
46
47
48
49
50
51
52
53
54
55
56
57
58
59
60
61
62
63
64
65
66
67
68
69
70
71
72
73
74
75
76
77
78
79
80
81
82
83
84
85
86
87
88
89
90
91
92
93
94
95
96
97
98
99
100
101
102
103
104
105
106
107
108
109
110
111
|
import numpy as np import matplotlib.pyplot as plt from matplotlib.patches import Polygon import matplotlib.patches as mpatches fig = plt.figure(figsize = (16,8)) ax = fig.gca() ax.set_xlim(-5,18) ax.set_ylim(-5,8) alpha = np.linspace(-np.pi,np.pi,30) t = np.linspace(-np.pi,np.pi,100) def ppp(nc , na , c , sx , sy): beta = alpha[na] gam = alpha[na+1] x = [] ; y = [] ; r = 0.5*nc x.append(r*np.cos(beta)) ; y.append(r*np.sin(beta)) ; tt = np.linspace(beta,gam,10) for i in range(len(tt)): x.append(r*np.cos(tt[i])) y.append(r*np.sin(tt[i])) r-=0.5 x.append(r*np.cos(gam)) ; y.append(r*np.sin(gam)) tt = np.linspace(gam,beta,10) for i in range(len(tt)): x.append(r*np.cos(tt[i])) ; y.append(r*np.sin(tt[i])) x = np.array(x) ; y = np.array(y) verts = list(zip(x+sx,y+sy)) poly = Polygon(verts , facecolor=c , edgecolor=c) ax.add_patch(poly) #ppp(2,0,'r',0,0) def get_coordiate(x , y): beta = (alpha[y]+alpha[y+1])/2 pr = 0.5*(x+x-1)/2 sx = pr*np.cos(beta) ; sy = pr*np.sin(beta) return sx,sy def pp_arrow(x,y): print x , y sx , sy = get_coordiate(x, y) for i in range(-1,2): for j in range(-1,2): if i == 0 and j == 0: continue ex , ey = get_coordiate(x+i, y+j) ax.arrow(sx,sy,ex-sx,ey-sy,head_width=0.05,head_length=0.1,fc='r',ec='r') def pxy(cx,cy): for i in range(10): plt.plot(0.5*i*np.cos(t)+cx,0.5*i*np.sin(t)+cy) for i in range(len(alpha)): plt.plot((0.5*np.cos(alpha)+cx,4.5*np.cos(alpha)+cx),(0.5*np.sin(alpha)+cy,4.5*np.sin(alpha)+cy)) cx = 13 ; cy =0pxy(0,0) pxy(13,0) mr = np.zeros((10,30)) mb = np.zeros((10,30)) for i in range(3,9): for j in range(1,27): ttt = np.random.random() if ttt >= 0.98 and ttt <= 1: ppp(i,j,'r',0,0) mr[i][j] = 1 continue if ttt < 0.8: continue else: ppp(i,j,'b',0,0) mb[i][j] = 1 for i in range(10): for j in range(30): if mr[i][j] == 0: continue pp_arrow(i, j) ma = 0 ;posx = 1 ; posy = 1 for k in range(-1,2): for s in range(-1,2): mb[i+k][j+s]=0 ttt = np.random.random() if ttt > ma: ma = ttt posx = k ; posy = s ppp(i+posx , j+posy , 'r' , 13 , 0) ppp(i,j,'g',13,0) for i in range(10): for j in range(30): if mb[i][j] == 0: continue ppp(i , j , 'b' , 13 , 0) arrow = mpatches.Arrow(5, 0 ,3,0,width = 1,color = 'r') ax.add_patch(arrow) ax.text(6.2,0.5,'after one\nunit time',ha='center',va='center',color='y') xx = [4,4,4] yy = [7.5,6.5,5.5] c = ['b' , 'r' , 'g'] s = ['debris','satellite' , 'the location of satellite one unit time ago'] for i in range(3): print xx[i] , yy[i] rect = mpatches.Rectangle((xx[i],yy[i]),0.5,0.3,ec = c[i],fc=c[i] ) ax.text(xx[i]+0.7,yy[i],s[i]) ax.add_patch(rect) plt.axis('off') plt.show() |
以上就是本文的全部内容,希望对大家的学习有所帮助,也希望大家多多支持服务器之家。
原文链接:http://blog.csdn.net/cq_pf/article/details/50629768


