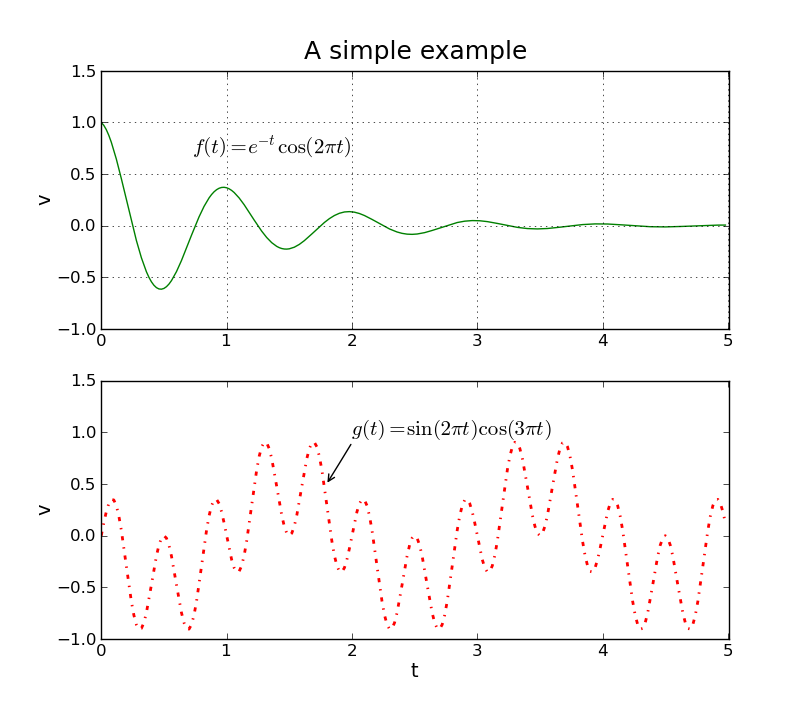
在使用pyplot画图的时候,有时会需要在图上标注一些文字,如果曲线靠的比较近,最好还能用箭头指出标注文字和曲线的对应关系。这里就介绍文字标注和箭头的使用。
添加标注使用pyplot.text,由pyplot或者subplot调用。下面是可以选择的参数,
text(tx,ty,fontsize=fs,verticalalignment=va,horizontalalignment=ha,...)
其中,tx和ty指定放置文字的位置,va和ha指定对其方式,可以是top,bottom,center或者left,right,center,还可以使文字带有边框,边框形状还可以是箭头,并指定方向。
添加箭头使用pyplot.annotate,调用方式与text类似。下面是可选择的参数,
annotate(text,xy=(tx0,ty0),xytext=(tx1,ty1),arrowprops=dict(arrowstyle="->",connectionstyle="arc3"))
其中,text是与箭头一起的文字,xy是箭头所在位置,终点,xytext是起点,arrowtypes指定箭头的样式,更多内容还是参见手册吧。
效果如下,

代码如下,只是在之前subplot的基础上做了一些修改,
|
1
2
3
4
5
6
7
8
9
10
11
12
13
14
15
16
17
18
19
20
21
22
23
24
25
26
27
28
29
30
31
32
33
34
35
36
37
38
39
40
41
42
43
44
45
|
#!/usr/bin/env pythonimport numpy as npimport matplotlib.pyplot as pltdef f1(t): return np.exp(-t)*np.cos(2*np.pi*t)def f2(t): return np.sin(2*np.pi*t)*np.cos(3*np.pi*t)t = np.arange(0.0,5.0,0.02)plt.figure(figsize=(8,7),dpi=98)p1 = plt.subplot(211)p2 = plt.subplot(212)label_f1 = "$f(t)=e^{-t} \cos (2 \pi t)$"label_f2 = "$g(t)=\sin (2 \pi t) \cos (3 \pi t)$"p1.plot(t,f1(t),"g-",label=label_f1)p2.plot(t,f2(t),"r-.",label=label_f2,linewidth=2)p1.axis([0.0,5.01,-1.0,1.5])p1.set_ylabel("v",fontsize=14)p1.set_title("A simple example",fontsize=18)p1.grid(True)#p1.legend()tx = 2ty = 0.9p1.text(tx,ty,label_f1,fontsize=15,verticalalignment="top",horizontalalignment="right")p2.axis([0.0,5.01,-1.0,1.5])p2.set_ylabel("v",fontsize=14)p2.set_xlabel("t",fontsize=14)#p2.legend()tx = 2ty = 0.9p2.text(tx,ty,label_f2,fontsize=15,verticalalignment="bottom",horizontalalignment="left")p2.annotate('',xy=(1.8,0.5),xytext=(tx,ty),arrowprops=dict(arrowstyle="->",connectionstyle="arc3"))plt.show() |
本来就很简单的东西,就不要弄太复杂了。
总结
以上就是本文关于浅谈Matplotlib简介和pyplot的简单使用——文本标注和箭头的全部内容,希望对大家有所帮助。如有不足之处,欢迎留言指出。感谢朋友们对本站的支持!
原文链接:https://www.cnblogs.com/Frandy/archive/2012/09/27/python_pyplot_subplot_label_text_arrow.html


