对以下数据画图结果图不显示,修改过程如下
|
1
2
3
|
df3 = {'chinese':109, 'american':88, 'german': 66, 'korea':23, 'japan':5, 'england':118}df4 = pd.dataframe(df3) |
运行结果:valueerror: if using all scalar values, you must pass an index
原因:缺少索引
修改后:
|
1
2
3
4
5
6
7
|
#方式1:df4 = pd.dataframe.from_dict(df3,orient='index').tdf4.plot(kind='barh', rot=0)print df4#结果: korea england chinese german american japan0 23 118 109 66 88 5 |
|
1
2
3
4
5
6
7
8
9
10
11
12
|
#方式2:df5 = pd.dataframe({"key": df3.keys(), "value": df3.values()})print df5#结果为: key value0 korea 231 england 1182 chinese 1093 german 664 american 885 japan 5 |
|
1
2
3
4
5
6
7
|
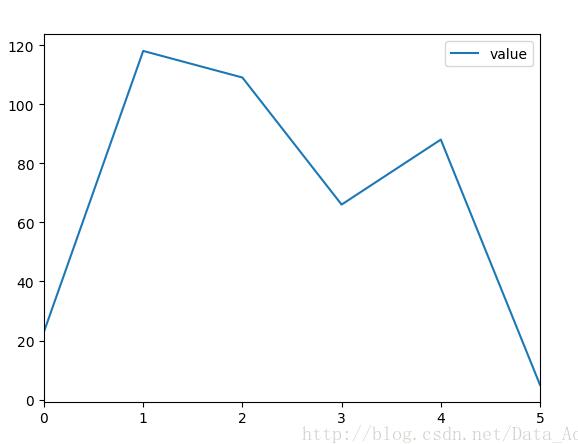
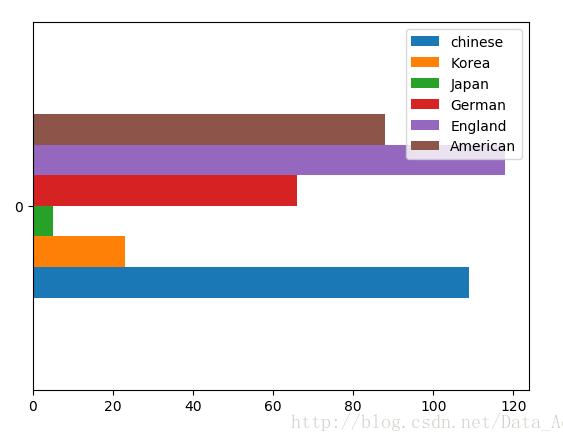
# 作图语句:df4.plot()df5.plot(kind='barh', rot=0)#运行以上语句图片不显示#增加以下句子后出现图片import matplotlib.pyplot as pltplt.show() |
df4的图结果

df5的图结果

以上这篇解决python中使用plot画图,图不显示的问题就是小编分享给大家的全部内容了,希望能给大家一个参考,也希望大家多多支持服务器之家。
原文链接:https://blog.csdn.net/Data_Ada/article/details/72873352


