1:首先要用到echarts
2:在vue中安装这个依赖
3:引入要用的页面
|
1
|
import echarts from 'echarts'; |
4:然后初始化
|
1
2
3
4
5
6
7
8
9
10
11
12
13
14
15
16
17
18
19
20
21
22
23
24
25
26
27
28
29
30
31
32
33
34
35
36
37
38
39
40
41
42
43
44
45
46
47
48
49
50
51
52
53
54
55
56
57
58
59
60
61
62
63
64
65
66
67
68
69
70
71
72
73
74
75
76
77
78
79
80
81
82
83
84
85
86
87
88
89
90
91
92
93
94
95
96
97
98
99
100
101
102
103
104
105
106
107
108
109
110
111
112
113
114
115
116
117
118
119
120
121
122
123
124
125
126
127
128
129
130
131
132
133
134
135
136
137
138
139
140
141
142
143
144
145
146
147
148
149
150
151
152
153
154
155
156
157
158
159
160
161
162
163
164
165
166
167
168
169
170
171
172
173
174
175
176
177
178
179
180
181
182
183
184
185
186
187
188
189
190
191
192
193
194
195
196
197
198
199
200
201
202
203
204
205
206
207
208
209
210
211
212
213
214
215
216
217
218
219
220
221
222
223
224
225
226
227
228
229
230
231
232
233
234
235
|
<template> <a-col span="12" style="min-height:343px;width:100%;background:#fff" ref="getwidth" :style="'display:'+ model"> <div class="layui-col-md6 tjgx-panel" > <div class="layui-card"> <div class="layui-card-header panel-title"> <span class="left-text" >统计更新及时率</span> <a class="close-link right-text" @click="onHide"> <a-icon type="close" style="color: #b0b0b0;" /> </a> <div class="right-text" style="color: #b0b0b0;"> <span v-for="(item,index) in activeList" :key="index" :class="item.is_active?'acitive':''" @click.stop="Onactive(item,index)" class="week " ref="alist">{{item.name}}</span> <!-- <span class="month">本月</span> <span class="year">本年</span> --> </div> </div> <div class="layui-card-body common-height"> <echartsModal :Maxwidths ="widths" :MinHeight="MHeight" :echartsColor="xAxis.color" :legendWAndH="legendWAndH" :xAxisData="xAxis.data" :seriesData="xAxis.x.data" :SerNameValue="xAxis.SerNameValue" :echartsName="xAxis.name" /> <!-- <div class="tjgx-con" id="container" style="min-height:280px;" :style="'width:'+widths+'px'" ></div> --> </div> </div> </div> </a-col></template><script>import echartsModal from '../../viewModal/Echarts'// import echarts from 'echarts';export default { components:{ echartsModal }, data(){ return{ model:'block', widths:'', legendWAndH:[15,15,18], MHeight:'', xAxis:{ data: ['广州', '深圳', '珠海', '汕头', '佛山', '韶关', '湛江', '肇庆', '江门', '茂名', '惠州', '梅州', '汕尾', '河源', '阳江', '清远', '东莞', '中山', '潮州', '揭阳', '云浮'], x:{ data: [7.9, 2, 6, 5, 7, 5, 7, 80, 6, 7, 6, 86, 6, 56, 7, 6, 8, 5, 4, 7, 8], // data: [87.9, 58, 67, 56, 72, 54, 74, 59, 64, 75, 68, 47, 63, 89, 78, 64, 82, 56, 40, 73, 80], }, name:'及时率', //图表名称 SerNameValue:{ position:'top', color:'#3398DB', // }, // color:'' //图表颜色 color:'#3398DB' //图表颜色 }, activeList:[ { name:'本周', is_active:true, }, { name:'本月', is_active:false, }, { name:'本年', is_active:false, }, ] } }, mounted(){ this.widths = String((this.$refs.getwidth.$el.clientWidth) - 30) ; //画布宽度 this.MHeight =String((this.$refs.getwidth.$el.clientHeight) - 68) //画布高度 }, methods:{ onHide(){ const _this = this; _this.model = 'none'; _this.$emit('isHide', _this.model,0) }, Onactive(val,index){ const _this = this let Alist = _this.activeList let Length = _this.$refs.alist.length let axis = _this.xAxis let sumber = 0; let arr = []; for( let t = 0; t < Length; t++ ){ Alist[t].is_active = false; } if( val.name == '本周' ){ sumber = 1 }else if ( val.name =='本月' ){ sumber = 1 }else if( val.name == '本年' ){ sumber = 1 } Alist[index].is_active = true; axis.x.data.map(item=>{ item += sumber arr.push(item) }) axis.x.data = arr _this.xAxis = axis _this.activeList = Alist } }}</script><style scoped>/* .week{ padding: 0 1%;} */.layui-card-header { position: relative; height: 42px; line-height: 42px; padding: 0 15px; border-bottom: 1px solid #f6f6f6; color: #333; border-radius: 2px 2px 0 0; font-size: 14px;}.common-height { height: 280px;}.layui-card { margin-bottom: 15px; border-radius: 2px; background-color: #fff; box-shadow: 0 1px 2px 0 rgba(0,0,0,.05);}.layui-card-body { position: relative; padding: 10px 15px; line-height: 24px;} .layui-col-md20 { width: 20%; } .time-city-panel { display: flex !important; justify-content: space-between; align-items: center; } .time-city-panel img { width: 73px !important; height: 61px !important; padding: 0 10px 10px !important; } .time-city-panel .one-row, .time-city-panel .two-row { padding: 0 10px; } .time-city-panel .one-row p:first-of-type { font-size: 18px; font-weight: bold; padding: 0 0 10px; text-align: left; } .time-city-panel .two-row p:first-of-type { padding: 0 0 10px; color: #96acbc; font-weight: bold; line-height: 22px; } .db_img { width: 20px; height: 22px; margin: 0 5px; vertical-align: middle; } .panel-title .left-text { padding-left: 10px; border-left: 8px solid #239fe6; font-size: 20px; display: inline-block; height: 30px; line-height: 30px; vertical-align: middle; } .panel-title .right-text { float: right; color: #239fe6; font-size: 14px; margin-left: 15px; } /*筒高度*/ .common-height { height: 280px; } .text-overflow { white-space: nowrap; overflow: hidden; text-overflow: ellipsis; } .tjgx-panel .right-text span, .ajtj-panel .right-text span { display: inline-block; color: #b0b0b0; } .tjgx-panel .right-text span.acitive, .ajtj-panel .right-text span.acitive { color: #239fe6; } #chart, #ajtjChart { width: 100%; height: 90%; } </style> |
5:Echarts 组件
|
1
2
3
4
5
6
7
8
9
10
11
12
13
14
15
16
17
18
19
20
21
22
23
24
25
26
27
28
29
30
31
32
33
34
35
36
37
38
39
40
41
42
43
44
45
46
47
48
49
50
51
52
53
54
55
56
57
58
59
60
61
62
63
64
65
66
67
68
69
70
71
72
73
74
75
76
77
78
79
80
81
82
83
84
85
86
87
88
89
90
91
92
93
94
95
96
97
98
99
100
101
102
103
104
105
106
107
108
109
110
111
112
113
114
115
116
117
118
119
120
121
122
123
124
125
126
127
128
129
130
131
132
133
134
135
136
137
138
139
140
141
142
143
144
145
146
147
148
149
150
151
152
153
154
155
156
157
158
159
160
161
162
163
164
165
166
167
168
169
170
171
172
173
174
175
176
177
178
179
180
181
182
183
184
185
186
187
188
189
190
191
192
193
194
195
196
197
198
199
200
201
202
203
204
205
206
207
208
209
210
211
212
213
214
215
216
217
218
219
220
221
222
223
224
225
226
227
228
229
230
231
232
233
234
235
236
237
238
239
240
241
242
243
244
245
246
247
248
249
250
251
252
253
254
255
256
257
258
259
260
261
262
263
264
265
266
267
268
269
270
271
|
<template> <div> <!-- style="min-height:280px;" --> <div id="Echarts" :style="'width:'+Maxwidths+'px;min-height:'+MinHeight+'px'" ></div> <!-- <div id="Echarts" v-if="Isgrid == false" :style="'width:'+Maxwidths+'px;height:'+MinHeight+'px'" ></div> --> </div></template><script>import echarts from 'echarts';import { number } from 'echarts/lib/export';export default { props:{ Isgrid:{ type:Boolean, default:()=> true //默认显示柱状图 }, ss:{ type:Object, default:()=>{} }, Maxwidths:{ type:String, //整个容器的宽度 default:'' }, MinHeight:{ type:String, //最小高度 default:'' }, echartsColor:{ //图像的颜色 type:String, default:'' }, legendWAndH:{ //图例的宽高位置等 type:Array, default:()=>[15,15,18] }, legendColor:{ type:String, default:()=>'' //图例的颜色,如果不加则默认是图形颜色 }, xAxisData:{ //图形X轴的数据 type:Array, default:()=>[] }, YAxisName:{ //图形y轴的名称设置 数组或者百分比 type:Object, default:()=>{} // default:{name:'111',formatter: '{value}%'} }, seriesData:{ type:Array, // 显示图像的数据 占据的多少 default:()=>[] }, SerNameValue:{ //图形数据分析的占据的位置 left right top bottom 和显示的颜色 type:Object, default:()=>{} // default:{position:top,color: '#3398DB',formatter: '{c}%'} }, echartsName:{ //图形的名称 type:String, default:()=>'柱状图' }, XorYatter:{ type:Array, default:()=>['{value}%','{c}%'] //默认为百分比 }, //雷达图的参数 gWidth:{ //宽度默认为百分百 type:String, default:()=>'100' }, gHeight:{ type:String, default:()=> '90' //高度默认为90 }, gridValue:{ /// 雷达图的名称等等 格式[{text:11}] type:Array, default:()=>[] }, gridraius:{ //圆圈大小 type:Number, default:()=> 80 //默认为80 }, gridTextStyle:{ //名称的默认颜色 text type:String, default:()=>'#6bbcef' }, symbolSize:{ // 圆点的大小 type:Number, default:()=> 10 }, SerValue:{ type:Array, default:()=>[] //网格里面对应的数值 }, serVcolor:{ type:String, default:()=> '#1bbdf8' //数值的默认颜色 SerValue的 }, lineStyleColor:{ type:String, default:()=> '#1cbdf8' //连接线的颜色 }, itemStyleColor:{ type:String, default:()=> '#1cbdf8' //连接圆点的默认颜色 }, BgColor:{ type:String, default:()=> 'rgba(189, 230, 249, 0.5)' } }, data(){ return{ option:{ color:[], //图例颜色 legend:{ data:[], //图例名称 itemWidth:0, //图例的宽度 itemHeight:0, //图例的高度 right:0, textStyle:{ color:'' } }, xAxis:{ data:[] //x轴数据 }, yAxis:{ name:'', //名称 axisLabel:{ formatter:'' //是否显示百分比 } }, series:[ { name:'', type:'bar', //类型 data:[], //X轴显示的数据 label:{ normal:{ show:true, position:'', color:'', formatter:'' } } } ] }, options:{ radar:[ { indicator:[], // 显示的名称的字段只能是text ps:[{text:'aaa'}] radius:0, //园角 name:{ textStyle:{ color:'' //颜色 } }, symbolSize:0, //圆点大小 } ], series:[ { type:'radar', data:[{ value:[], //对应的数据 label:{ normal:{ show:true, color:'', //选中的时候颜色 formatter:(params)=>{ return params.value; } } }, //连接线颜色 lineStyle:{ color:'', }, // 连接圆点颜色 itemStyle:{ color:'' }, // 图表背景网格的颜色 areaStyle:{ normal:{ opacity:0.9, color:'' } } }] } ] } } }, created(){ const _this = this; console.log(_this.Isgrid) console.log(this.ECharts) if( _this.Isgrid ){ _this.onloads() //初始化数据 }else{ _this.isInitGrid() } }, mounted(){ const _this = this; if(_this.ss){ _this.option = {} _this.option = _this.ss; } setTimeout(()=>{ _this.$nextTick(()=>{ let Echarts = echarts.init(document.getElementById('Echarts')) Echarts.setOption(_this.option,true) }) },500) }, watch:{ seriesData(val){ this.seriesData = val this.onloads(true) } }, methods:{ onloads(is){ const _this = this; let op = _this.option op.color = [_this.echartsColor] op.legend.data = [_this.echartsName] op.legend.itemWidth =_this.legendWAndH[0] op.legend.itemHeight =_this.legendWAndH[1] op.legend.right =_this.legendWAndH[2] op.legend.textStyle.color =_this.legendColor == '' ? _this.echartsColor:'' op.xAxis.data = _this.xAxisData op.yAxis.name = _this.echartsName op.yAxis.axisLabel.formatter = _this.XorYatter[0] op.series[0].data = _this.seriesData op.series[0].name = _this.echartsName op.series[0].label.normal.position = _this.SerNameValue.position op.series[0].label.normal.formatter = _this.XorYatter[1] op.series[0].label.normal.color = _this.SerNameValue.color == '' ? _this.echartsColor:_this.SerNameValue.color _this.option = op; if( is ){ _this.$nextTick(()=>{ let Echarts = echarts.init(document.getElementById('Echarts')) Echarts.setOption(op,true) }) } }, isInitGrid(){ const _this = this; let g = _this.options; g.radar[0].indicator = _this.gridValue g.radar[0].radius = _this.gridraius g.radar[0].name.textStyle.color = _this.gridTextStyle g.radar[0].symbolSize = _this.symbolSize g.series[0].data[0].value = _this.SerValue g.series[0].data[0].label.normal.color = _this.serVcolor g.series[0].data[0].lineStyle.color = _this.lineStyleColor g.series[0].data[0].itemStyle.color = _this.itemStyleColor g.series[0].data[0].areaStyle.normal.color = _this.BgColor } }}</script> |
6:效果图
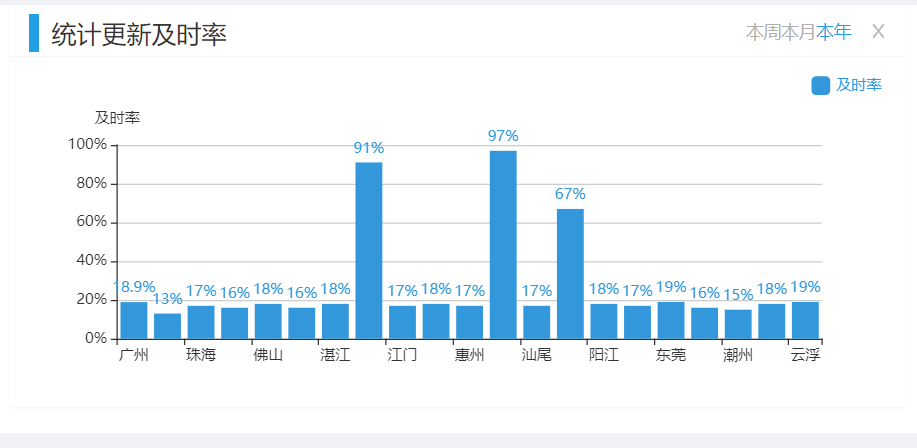
以上就是vue中使用echarts的步骤的详细内容,更多关于vue 使用echarts的资料请关注服务器之家其它相关文章!
原文链接:https://www.cnblogs.com/Myzhuo/p/13984710.html


