1. 前言
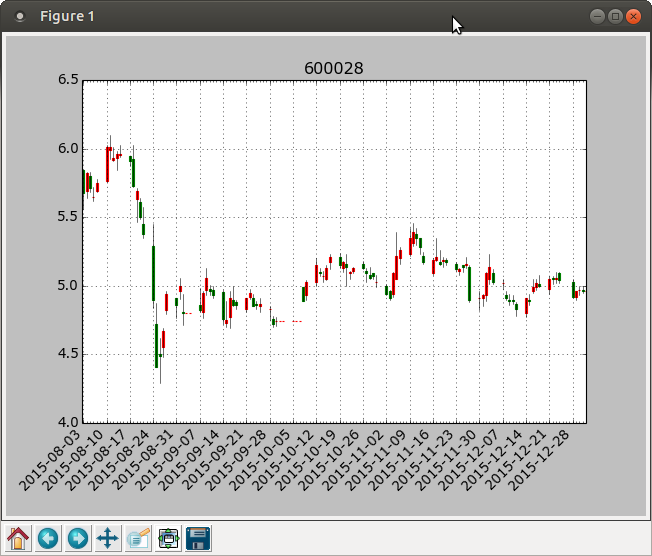
当日期数据作为图表的坐标轴时通常需要特殊处理,应为日期字符串比较长,容易产生重叠现象
2. 设定主/次刻度
2.1 引用库
|
1
|
from matplotlib.dates import DateFormatter, WeekdayLocator, DayLocator, MONDAY,YEARLY |
2.2 获取每月/周/日数据
获取每月一日数据
|
1
|
monthdays = MonthLocator() |
获取每周一的日期数据
|
1
|
mondays = WeekdayLocator(MONDAY) # 主要刻度 |
获取每日数据
|
1
|
alldays = DayLocator() # 次要刻度 |
2.3 设定主/次刻度
|
1
2
|
ax.xaxis.set_major_locator(mondays)ax.xaxis.set_minor_locator(alldays) |
2.4 设定格式
|
1
2
3
|
mondayFormatter = DateFormatter('%Y-%m-%d') # 如:2-29-2015dayFormatter = DateFormatter('%d') # 如:12ax.xaxis.set_major_formatter(mondayFormatter) |
3. 字符串旋转
|
1
2
3
|
for label in ax1.get_xticklabels():label.set_rotation(30)label.set_horizontalalignment('right') |
4. 效果

以上就是本文的全部内容,希望对大家的学习有所帮助,也希望大家多多支持服务器之家。
原文链接:https://blog.csdn.net/matrix_laboratory/article/details/50699786


