今天使用python画了几个好玩的3d展示图,现在分享给大家。
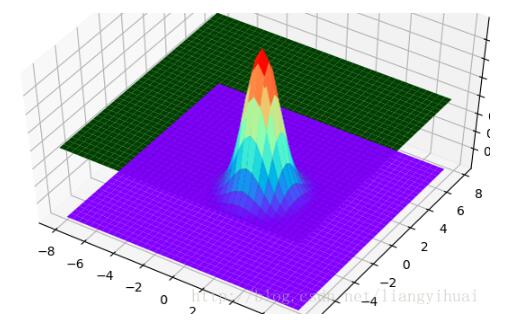
先贴上图片


使用的python工具包为:
|
1
2
3
|
from matplotlib import pyplot as pltimport numpy as npfrom mpl_toolkits.mplot3d import axes3d |
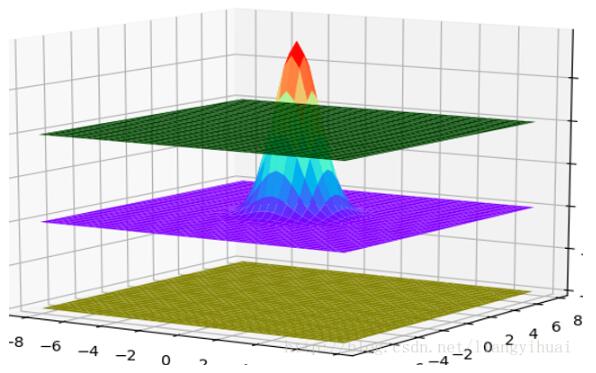
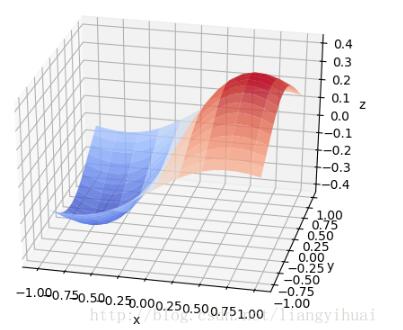
在贴代码之前,有必要从整体上了解这些图是如何画出来的。可以把上面每一个3d图片理解成一个长方体。输入数据是三维的,x轴y轴和z轴。在第三个图片里面有x、y和z坐标的标识。在第三张图片中,我们可以理解为,z是随着x和y变化的函数。就像一个人在山丘地区走动一样,其中x和y表示的是方向,z表示的这个人在上坡还是下坡。第二张图片的中间那个,其实是一个3维的正态分布图。
具体的公式为:

上面的是2维的,即只有x和y,如果是三维的话,需要一点变形,只需要在上面的公式基础之上把exp()里面改变为:exp(-((x-u)^2 + (y - u)^2)/(2q^2)), 这里的u表示平均值,q表示标准差。这样变化之后,z = f(x, y)。这就是z值的公式了,表示的是z值随着x和y值的变化而变化的函数。
下面贴一下代码
这是第二张图片的代码。
|
1
2
3
4
5
6
7
8
9
10
11
12
13
14
15
16
17
18
19
20
21
22
23
24
25
26
27
28
29
30
31
32
33
34
35
36
37
38
39
40
41
42
43
44
45
46
47
48
49
50
51
52
53
54
55
56
57
58
59
60
61
62
63
64
65
66
|
from matplotlib import pyplot as pltimport numpy as npfrom mpl_toolkits.mplot3d import axes3dfig = plt.figure()ax = axes3d(fig)len = 8;step = 0.4;def build_layer(z_value): x = np.arange(-len, len, step); y = np.arange(-len, len, step); z1 = np.full(x.size, z_value/2) z2 = np.full(x.size, z_value/2) z1, z2 = np.meshgrid(z1, z2) z = z1 + z2; x, y = np.meshgrid(x, y) return (x, y, z);def build_gaussian_layer(mean, standard_deviation): x = np.arange(-len, len, step); y = np.arange(-len, len, step); x, y = np.meshgrid(x, y); z = np.exp(-((y-mean)**2 + (x - mean)**2)/(2*(standard_deviation**2))) z = z/(np.sqrt(2*np.pi)*standard_deviation); return (x, y, z);# 具体函数方法可用 help(function) 查看,如:help(ax.plot_surface)x1, y1, z1 = build_layer(0.2);ax.plot_surface(x1, y1, z1, rstride=1, cstride=1, color='green')x5, y5, z5 = build_layer(0.15);ax.plot_surface(x5, y5, z5, rstride=1, cstride=1, color='pink')# x2, y2, z2 = build_layer(-0.26);# ax.plot_surface(x2, y2, z2, rstride=1, cstride=1, color='yellow')## x6, y6, z6 = build_layer(-0.22);# ax.plot_surface(x6, y6, z6, rstride=1, cstride=1, color='pink')# x4, y4, z4 = build_layer(0);# ax.plot_surface(x4, y4, z4, rstride=1, cstride=1, color='purple')x3, y3, z3 = build_gaussian_layer(0, 1)ax.plot_surface(x3, y3, z3, rstride=1, cstride=1, cmap='rainbow')plt.show()这是第三张图片的代码import numpy as npimport matplotlib.pyplot as pltimport mpl_toolkits.mplot3dx, y = np.mgrid[-1:1:20j, -1:1:20j]z = x * np.exp(-x ** 2 - y ** 2)ax = plt.subplot(111, projection='3d')ax.plot_surface(x, y, z, rstride=2, cstride=1, cmap=plt.cm.coolwarm, alpha=0.8)ax.set_xlabel('x')ax.set_ylabel('y')ax.set_zlabel('z')plt.show() |
以上这篇使用python绘制3维正态分布图的方法就是小编分享给大家的全部内容了,希望能给大家一个参考,也希望大家多多支持服务器之家。
原文链接:https://blog.csdn.net/liangyihuai/article/details/78501017


