本文是利用shapmap实现gis的简单应用的小例子,以供学习分享使用。关于sharpmap的说明,网上大多是以shapefile为例进行简单的说明,就连官网上的例子也不多。本文是自己参考了源代码进行整理的,主要是winform的例子。原理方面本文也不过多论述,主要是实例演示,需要的朋友还是以sharpmap源码进行深入研究。
什么是sharpmap ?
sharpmap是一个基于.net 2.0使用c#开发的map渲染类库,可以渲染各类gis数据(目前支持esri shape和postgis格式),可应用于桌面和web程序。代码行数近10000行,可以算是一个实现了最基本功能的gis系统,有利于研究学习使用。
涉及知识点:
- sharpmap的基本概念:layer(图层,常用图层:vectorlayer,labellayer) , iprovider(数据提供者,常用数据源:ogr(对应mapinfo),shapfile,datatablepoint(对应dataset))
- 坐标转换:主要用于经纬度和地图坐标的转换。
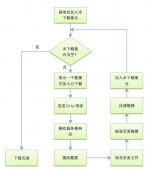
sharpmap知识结构图:

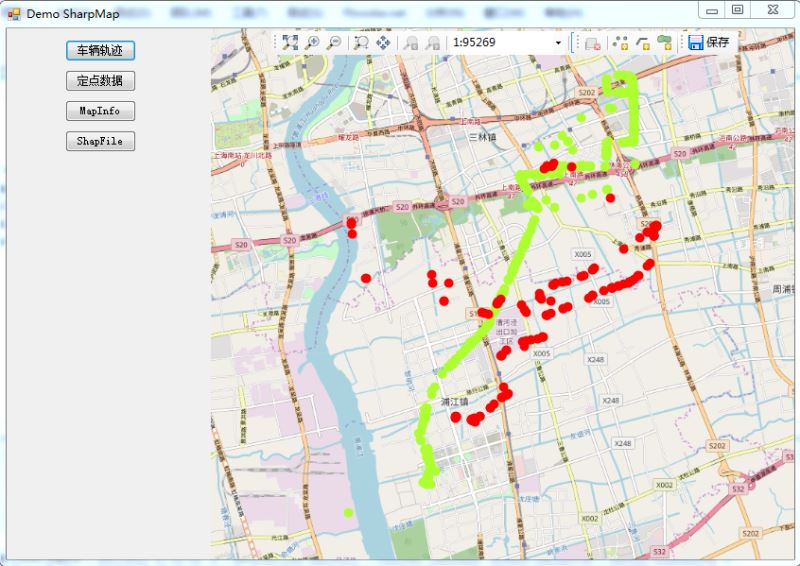
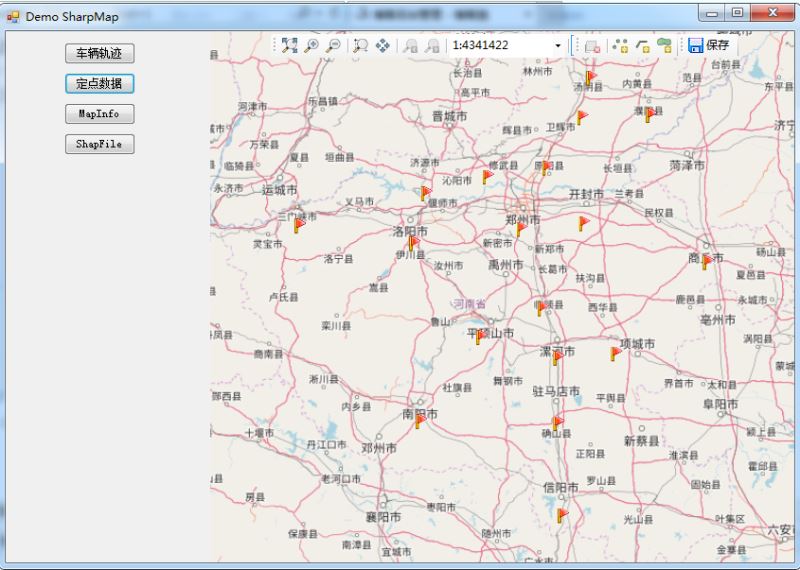
效果图如下:
(一)车辆轨迹图:数据源:excel数据
(二)定点数据(数据源:excel)将河南省十七个城市,全部插上小红旗
(三)使用mapinfo做背景文件(此处通过程序调整了比例尺)
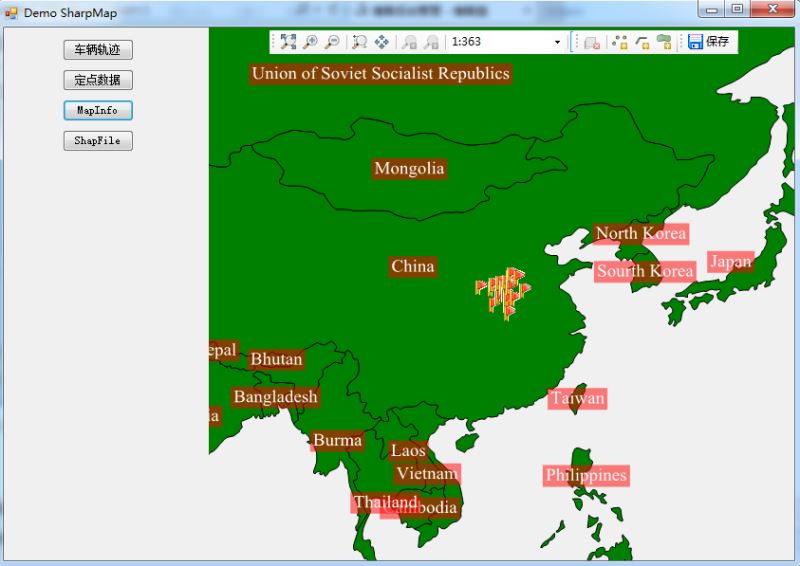
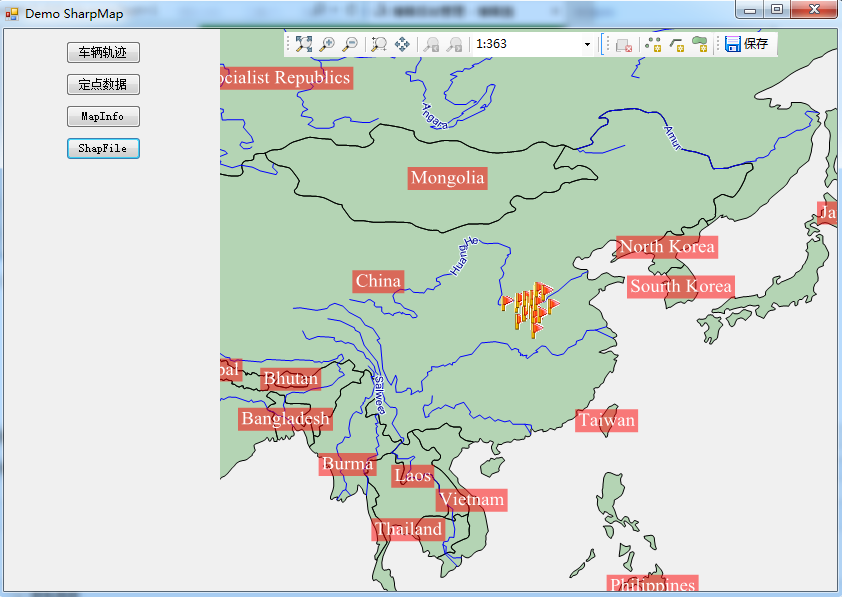
(四)使用shapfile做背景图
核心代码
|
1
2
3
4
5
6
7
8
9
10
11
12
13
14
15
16
17
18
19
20
21
22
23
24
25
26
27
28
29
30
31
32
33
34
35
36
37
38
39
40
41
42
43
44
45
46
47
48
49
50
51
52
53
54
55
56
57
58
59
60
61
62
63
64
65
66
67
68
69
70
71
72
73
74
75
76
77
78
79
80
81
82
83
84
85
86
87
88
89
90
91
92
93
94
95
96
97
98
99
100
101
102
103
104
105
106
107
108
109
110
111
112
113
114
115
116
117
118
119
120
121
122
123
124
125
126
127
128
129
130
131
132
133
134
135
136
137
138
139
140
141
142
143
144
145
146
147
148
149
150
151
152
153
154
155
156
157
158
159
160
161
162
163
164
165
166
167
168
169
170
171
172
173
174
175
176
177
178
179
180
181
182
183
184
185
186
187
188
189
190
191
192
193
194
195
196
197
198
199
200
201
202
203
204
205
206
207
208
209
210
211
212
213
214
215
216
217
218
219
220
221
222
223
224
225
226
227
228
229
230
231
232
233
234
235
236
237
238
239
240
241
242
243
244
245
246
247
248
249
250
251
252
253
254
255
256
257
258
259
260
261
262
263
264
265
266
267
268
269
270
271
272
273
274
275
276
277
278
279
280
281
282
283
284
285
286
287
288
289
290
291
292
293
294
295
296
297
298
299
300
301
302
303
304
305
306
307
308
309
310
311
312
313
314
315
316
317
318
319
320
321
322
323
324
325
326
327
328
329
330
331
332
333
334
335
336
337
338
339
340
341
342
343
344
345
346
347
348
349
350
351
352
353
354
355
356
357
358
359
360
361
362
363
364
365
366
367
368
369
370
371
372
373
374
375
376
377
378
379
380
381
382
383
384
385
386
387
388
389
390
391
392
393
394
395
396
397
398
399
400
401
402
403
404
405
406
407
408
409
410
411
412
413
414
415
416
417
418
419
420
421
422
423
424
425
426
427
428
429
430
431
432
433
434
435
436
437
438
439
440
441
442
443
444
445
446
447
448
449
450
451
452
453
454
455
456
457
458
459
460
461
462
463
464
465
466
467
468
469
470
471
472
473
474
475
476
|
using brutile.predefined;using geoapi.coordinatesystems.transformations;using projnet.coordinatesystems;using projnet.coordinatesystems.transformations;using sharpmap;using sharpmap.data.providers;using sharpmap.layers;using sharpmap.rendering;using sharpmap.rendering.thematics;using sharpmap.styles;using system;using system.collections.generic;using system.data;using system.data.oledb;using system.drawing;using system.drawing.drawing2d;using system.drawing.text;using system.linq;using system.text;using point = geoapi.geometries.coordinate;namespace demosharpmap{ public class sharpmaphelper { private const string xlsconnectionstring = "provider={2};data source={0}\\{1};extended properties=\"excel 8.0;hdr=yes;imex=1\""; public static map initializemap(maptype tt,float angle) { map map = null; switch (tt) { case maptype.runline: map = initializemaposmwithxls(angle); break; case maptype.mapinfo: map = initializemapinfo(angle); break; case maptype.shapefile: map = initializemaporig(angle); break; case maptype.static: map = initializemaposmwithxls2(angle); break; default: map = initializemaposmwithxls(angle); break; } return map; } /// <summary> /// mapinfo格式的地图文件 /// </summary> /// <param name="angle"></param> /// <returns></returns> private static map initializemapinfo(float angle) { //initialize a new map of size 'imagesize' map map = new map(); //set up the countries layer vectorlayer laycountries = new vectorlayer("countries"); //set the datasource to a shapefile in the app_data folder try { laycountries.datasource = new ogr("geodata/mapinfo/countriesmapinfo.tab"); } catch (typeinitializationexception ex) { if (ex.message == "the type initializer for 'osgeo.ogr.ogr' threw an exception.") { throw new exception( string.format( "the application threw a pinvoke exception. you probably need to copy the unmanaged dll's to your bin directory. they are a part of fwtools {0}. you can download it from: http://home.gdal.org/fwtools/", gdalrasterlayer.fwtoolsversion)); } throw; } //set fill-style to green laycountries.style.fill = new solidbrush(color.green); //set the polygons to have a black outline laycountries.style.outline = pens.black; laycountries.style.enableoutline = true; laycountries.srid = 4326; //set up a river layer vectorlayer layrivers = new vectorlayer("rivers"); //set the datasource to a shapefile in the app_data folder layrivers.datasource = new ogr("geodata/mapinfo/riversmapinfo.tab"); //define a blue 1px wide pen layrivers.style.line = new pen(color.blue, 1); layrivers.srid = 4326; //set up a river layer vectorlayer laycities = new vectorlayer("cities"); //set the datasource to a shapefile in the app_data folder laycities.datasource = new ogr("geodata/mapinfo/citiesmapinfo.tab"); laycities.style.symbolscale = 0.8f; laycities.maxvisible = 40; laycities.srid = 4326; //set up a country label layer labellayer laylabel = new labellayer("country labels"); laylabel.datasource = laycountries.datasource; laylabel.enabled = true; laylabel.labelcolumn = "name"; laylabel.style = new labelstyle(); laylabel.style.forecolor = color.white; laylabel.style.font = new font(fontfamily.genericserif, 12); laylabel.style.backcolor = new solidbrush(color.fromargb(128, 255, 0, 0)); laylabel.maxvisible = 90; laylabel.minvisible = 30; laylabel.style.horizontalalignment = labelstyle.horizontalalignmentenum.center; laylabel.srid = 4326; laylabel.multipartgeometrybehaviour = labellayer.multipartgeometrybehaviourenum.largest; //set up a city label layer labellayer laycitylabel = new labellayer("city labels"); laycitylabel.datasource = laycities.datasource; laycitylabel.enabled = true; laycitylabel.labelcolumn = "name"; laycitylabel.style = new labelstyle(); laycitylabel.style.forecolor = color.black; laycitylabel.style.font = new font(fontfamily.genericserif, 11); laycitylabel.maxvisible = laylabel.minvisible; laycitylabel.style.horizontalalignment = labelstyle.horizontalalignmentenum.left; laycitylabel.style.verticalalignment = labelstyle.verticalalignmentenum.bottom; laycitylabel.style.offset = new pointf(3, 3); laycitylabel.style.halo = new pen(color.yellow, 2); laycitylabel.textrenderinghint = textrenderinghint.antialias; laycitylabel.smoothingmode = smoothingmode.antialias; laycitylabel.srid = 4326; laycitylabel.labelfilter = labelcollisiondetection.thoroughcollisiondetection; laycitylabel.style.collisiondetection = true; //add the layers to the map object. //the order we add them in are the order they are drawn, so we add the rivers last to put them on top map.layers.add(laycountries); map.layers.add(layrivers); map.layers.add(laycities); map.layers.add(laylabel); map.layers.add(laycitylabel); //增加layers var xlspath = string.format(xlsconnectionstring, system.io.directory.getcurrentdirectory(), "geodata\\henan.xls", properties.settings.default.oledbprovider); var ds = getdatafromexcel(xlspath, "cities"); //var ct = getcoordinatetransformation(); //transcoordinate(ds, ct); string columename = "rotation"; //add rotation column addcolumetodataset(ds, columename, -angle); var xlslayer = getlayerfromdataset2(ds, color.greenyellow);//set up provider map.layers.add(xlslayer); //add layer to map map.center = xlslayer.envelope.centre;// new point(0, 0); map.mapscale = 350; //map.center = new point(0, 0); //_ogrsampledataset = "mapinfo"; //matrix mat = new matrix(); //mat.rotateat(angle, map.worldtoimage(map.center)); //map.maptransform = mat; //map.zoomtobox(xlslayer.envelope); return map; } /// <summary> /// shapefile /// </summary> /// <param name="angle"></param> /// <returns></returns> private static map initializemaporig(float angle) { //initialize a new map of size 'imagesize' map map = new map(); //set up the countries layer vectorlayer laycountries = new vectorlayer("countries"); //set the datasource to a shapefile in the app_data folder laycountries.datasource = new shapefile("geodata/world/countries.shp", true); //set fill-style to green laycountries.style.fill = new solidbrush(color.fromargb(64, color.green)); //set the polygons to have a black outline laycountries.style.outline = pens.black; laycountries.style.enableoutline = true; laycountries.srid = 4326; //set up a river layer vectorlayer layrivers = new vectorlayer("rivers"); //set the datasource to a shapefile in the app_data folder layrivers.datasource = new shapefile("geodata/world/rivers.shp", true); //define a blue 1px wide pen layrivers.style.line = new pen(color.blue, 1); layrivers.srid = 4326; //set up a cities layer vectorlayer laycities = new vectorlayer("cities"); //set the datasource to a shapefile in the app_data folder laycities.datasource = new shapefile("geodata/world/cities.shp", true); laycities.style.symbolscale = 0.8f; laycities.maxvisible = 40; laycities.srid = 4326; //set up a country label layer labellayer laylabel = new labellayer("country labels"); laylabel.datasource = laycountries.datasource; laylabel.enabled = true; laylabel.labelcolumn = "name"; laylabel.style = new labelstyle(); laylabel.style.forecolor = color.white; laylabel.style.font = new font(fontfamily.genericserif, 12); laylabel.style.backcolor = new solidbrush(color.fromargb(128, 255, 0, 0)); laylabel.maxvisible = 90; laylabel.minvisible = 30; laylabel.style.horizontalalignment = labelstyle.horizontalalignmentenum.center; laylabel.srid = 4326; laylabel.multipartgeometrybehaviour = labellayer.multipartgeometrybehaviourenum.largest; laylabel.labelfilter = labelcollisiondetection.thoroughcollisiondetection; laylabel.style.collisiondetection = true; laylabel.labelpositiondelegate = fdr => fdr.geometry.interiorpoint.coordinate; laylabel.prioritycolumn = "popdens"; //set up a city label layer labellayer laycitylabel = new labellayer("city labels"); laycitylabel.datasource = laycities.datasource; laycitylabel.enabled = true; laycitylabel.labelcolumn = "name"; laycitylabel.style = new labelstyle(); laycitylabel.style.forecolor = color.black; laycitylabel.style.font = new font(fontfamily.genericserif, 11); laycitylabel.maxvisible = laylabel.minvisible; laycitylabel.style.horizontalalignment = labelstyle.horizontalalignmentenum.left; laycitylabel.style.verticalalignment = labelstyle.verticalalignmentenum.bottom; laycitylabel.style.offset = new pointf(3, 3); laycitylabel.style.halo = new pen(color.yellow, 2); laycitylabel.textrenderinghint = textrenderinghint.antialias; laycitylabel.smoothingmode = smoothingmode.antialias; laycitylabel.srid = 4326; laycitylabel.labelfilter = labelcollisiondetection.thoroughcollisiondetection; laycitylabel.style.collisiondetection = true; laycitylabel.prioritycolumn = "population"; laycitylabel.theme = new gradienttheme(laycitylabel.prioritycolumn, 250000, 5000000, new labelstyle { maxvisible = 10, collisionbuffer = new size(0, 0), collisiondetection = true, enabled = true, forecolor = color.lightslategray, halo = new pen(color.silver, 1), horizontalalignment = labelstyle.horizontalalignmentenum.center, verticalalignment = labelstyle.verticalalignmentenum.middle, font = new font(genericfontfamilies.sansserif.tostring(), 8f, fontstyle.regular) }, new labelstyle { maxvisible = laylabel.minvisible, collisionbuffer = new size(3, 3), collisiondetection = true, enabled = true, forecolor = color.lightslategray, halo = new pen(color.silver, 5), horizontalalignment = labelstyle.horizontalalignmentenum.center, verticalalignment = labelstyle.verticalalignmentenum.middle, font = new font(genericfontfamilies.sansserif.tostring(), 16f, fontstyle.bold) }); bool ignorelength = false; var layriverlabel = new labellayer("river labels") { datasource = layrivers.datasource, enabled = true, labelcolumn = "name", textrenderinghint = textrenderinghint.antialias, smoothingmode = smoothingmode.antialias, srid = 4326, labelfilter = labelcollisiondetection.thoroughcollisiondetection, multipartgeometrybehaviour = labellayer.multipartgeometrybehaviourenum.commoncenter, style = new labelstyle { forecolor = color.darkblue, font = new font(fontfamily.genericsansserif, 11), horizontalalignment = labelstyle.horizontalalignmentenum.center, verticalalignment = labelstyle.verticalalignmentenum.middle, //collisiondetection = true, halo = new pen(color.azure, 2), ignorelength = ignorelength, offset = new pointf(0, -10) }, }; //add the layers to the map object. //the order we add them in are the order they are drawn, so we add the rivers last to put them on top //map.backgroundlayer.add(asynclayerproxylayer.create(laycountries)); map.layers.add(laycountries); map.layers.add(layrivers); map.layers.add(laycities); map.layers.add(laylabel); map.layers.add(laycitylabel); map.layers.add(layriverlabel); //增加layers var xlspath = string.format(xlsconnectionstring, system.io.directory.getcurrentdirectory(), "geodata\\henan.xls", properties.settings.default.oledbprovider); var ds = getdatafromexcel(xlspath, "cities"); //var ct = getcoordinatetransformation(); //transcoordinate(ds, ct); string columename = "rotation"; //add rotation column addcolumetodataset(ds, columename, -angle); var xlslayer = getlayerfromdataset2(ds, color.greenyellow);//set up provider map.layers.add(xlslayer); //add layer to map //limit the zoom to 360 degrees width //map.maximumzoom = 360; //map.backcolor = color.lightblue; //map.zoom = 360; map.center = xlslayer.envelope.centre;// new point(0, 0); map.mapscale = 350; //matrix mat = new matrix(); //mat.rotateat(angle, map.worldtoimage(map.center)); //map.maptransform = mat; //map.zoomtobox(xlslayer.envelope); return map; } /// <summary> /// 在线显示,圆点显示轨迹 /// </summary> /// <param name="angle"></param> /// <returns></returns> private static map initializemaposmwithxls(float angle) { var map = new map(); var tilelayer = new tileasynclayer( knowntilesources.create(knowntilesource.openstreetmap), "tilelayer - osm with xls"); tilelayer.srid = 4326; map.backgroundlayer.add(tilelayer); //get data from excel var xlspath = string.format(xlsconnectionstring, system.io.directory.getcurrentdirectory(), "geodata\\cities.xls", properties.settings.default.oledbprovider); var ds = getdatafromexcel(xlspath, "cities"); var ds1 = getdatafromexcel(xlspath, "cities2"); var ct = getcoordinatetransformation(); transcoordinate(ds, ct); transcoordinate(ds1, ct); string columename = "rotation"; //add rotation column addcolumetodataset(ds, columename, -angle); addcolumetodataset(ds1, columename, -angle); var xlslayer = getlayerfromdataset(ds, color.greenyellow);//set up provider map.layers.add(xlslayer); //add layer to map var xlslayer1 = getlayerfromdataset(ds1, color.red); map.layers.add(xlslayer1); var xlslabellayer = getlabellayerbyvectorlayer(xlslayer, "xlslabel"); xlslabellayer.theme = new sharpmap.rendering.thematics.fontsizetheme(xlslabellayer, map) { fontsizescale = 1000f }; map.layers.add(xlslabellayer); map.zoomtobox(xlslayer.envelope.expandedby(xlslayer1.envelope)); return map; } /// <summary> /// 在线显示,图标显示轨迹 /// </summary> /// <param name="angle"></param> /// <returns></returns> private static map initializemaposmwithxls2(float angle) { var map = new map(); var tilelayer = new tileasynclayer( knowntilesources.create(knowntilesource.openstreetmap), "tilelayer - osm with xls"); tilelayer.srid = 4326; map.backgroundlayer.add(tilelayer); //get data from excel var xlspath = string.format(xlsconnectionstring, system.io.directory.getcurrentdirectory(), "geodata\\henan.xls", properties.settings.default.oledbprovider); var ds = getdatafromexcel(xlspath, "cities"); var ct = getcoordinatetransformation(); transcoordinate(ds, ct); string columename = "rotation"; //add rotation column addcolumetodataset(ds, columename, -angle); var xlslayer = getlayerfromdataset2(ds, color.greenyellow);//set up provider map.layers.add(xlslayer); //add layer to map var xlslabellayer = getlabellayerbyvectorlayer(xlslayer, "xlslabel"); xlslabellayer.theme = new fontsizetheme(xlslabellayer, map) { fontsizescale = 1000f }; map.layers.add(xlslabellayer); map.zoomtobox(xlslayer.envelope); return map; } /// <summary> /// 从excel中读取数据 /// </summary> private static dataset getdatafromexcel(string xlspath, string sheetname) { dataset ds = new dataset("xls"); string sql = string.format("select * from [{0}$];", sheetname); using (var cn = new oledbconnection(xlspath)) { cn.open(); using (var da = new oledbdataadapter(new oledbcommand(sql, cn))) { da.fill(ds); } } return ds; } /// <summary> /// 获取坐标转换对象 /// </summary> /// <returns></returns> private static icoordinatetransformation getcoordinatetransformation() { //the srs for this datasource is epsg:4326, therefore we need to transfrom it to osm projection var ctf = new coordinatetransformationfactory(); var cf = new coordinatesystemfactory(); var epsg4326 = cf.createfromwkt("geogcs[\"wgs 84\",datum[\"wgs_1984\",spheroid[\"wgs 84\",6378137,298.257223563,authority[\"epsg\",\"7030\"]],authority[\"epsg\",\"6326\"]],primem[\"greenwich\",0,authority[\"epsg\",\"8901\"]],unit[\"degree\",0.01745329251994328,authority[\"epsg\",\"9122\"]],authority[\"epsg\",\"4326\"]]"); var epsg3857 = cf.createfromwkt("projcs[\"popular visualisation crs / mercator\", geogcs[\"popular visualisation crs\", datum[\"popular visualisation datum\", spheroid[\"popular visualisation sphere\", 6378137, 0, authority[\"epsg\",\"7059\"]], towgs84[0, 0, 0, 0, 0, 0, 0], authority[\"epsg\",\"6055\"]],primem[\"greenwich\", 0, authority[\"epsg\", \"8901\"]], unit[\"degree\", 0.0174532925199433, authority[\"epsg\", \"9102\"]], axis[\"e\", east], axis[\"n\", north], authority[\"epsg\",\"4055\"]], projection[\"mercator\"], parameter[\"false_easting\", 0], parameter[\"false_northing\", 0], parameter[\"central_meridian\", 0], parameter[\"latitude_of_origin\", 0], unit[\"metre\", 1, authority[\"epsg\", \"9001\"]], axis[\"east\", east], axis[\"north\", north], authority[\"epsg\",\"3857\"]]"); var ct = ctf.createfromcoordinatesystems(epsg4326, epsg3857); return ct; } /// <summary> /// 转换地球经纬度到坐标 /// </summary> /// <param name="ds"></param> /// <param name="ct"></param> private static void transcoordinate(dataset ds, icoordinatetransformation ct) { foreach (system.data.datarow row in ds.tables[0].rows) { if (row["x"] == dbnull.value || row["y"] == dbnull.value) continue; var coords = new[] { convert.todouble(row["x"]), convert.todouble(row["y"]) }; coords = ct.mathtransform.transform(coords); row["x"] = coords[0]; row["y"] = coords[1]; } } /// <summary> /// 增加列 /// </summary> /// <param name="ds"></param> /// <param name="columename"></param> /// <param name="columevalue"></param> private static void addcolumetodataset(dataset ds, string columename, float columevalue) { ds.tables[0].columns.add(columename, typeof(float)); foreach (system.data.datarow row in ds.tables[0].rows) { row["rotation"] = -columevalue; } } /// <summary> /// 轨迹用点表示 /// </summary> /// <param name="ds"></param> /// <param name="c"></param> /// <returns></returns> private static vectorlayer getlayerfromdataset(dataset ds, color c) { var xlsprovider = new datatablepoint(ds.tables[0], "oid", "x", "y"); var xlslayer = new vectorlayer("xls", xlsprovider) { style = new vectorstyle() { pointcolor = new solidbrush(c) } }; return xlslayer; } /// <summary> /// 获取带图标的图层 /// </summary> /// <param name="ds"></param> /// <param name="c"></param> /// <returns></returns> private static vectorlayer getlayerfromdataset2(dataset ds, color c) { var xlsprovider = new datatablepoint(ds.tables[0], "oid", "x", "y"); var xlslayer = new vectorlayer("xls", xlsprovider) { style = { symbol=properties.resources.redflag} }; return xlslayer; } private static labellayer getlabellayerbyvectorlayer(vectorlayer xlslayer, string layername) { var xlslabellayer = new labellayer(layername) { datasource = xlslayer.datasource, labelcolumn = "name", //prioritycolumn = "population", style = { collisionbuffer = new system.drawing.sizef(2f, 2f), collisiondetection = true }, labelfilter = labelcollisiondetection.thoroughcollisiondetection }; return xlslabellayer; } } public enum maptype { shapefile = 0, mapinfo = 1, runline = 2,//运行轨迹 static = 3 //定点数据 }} |
备注:
1. 因用的mapinfo和shape源文件为源码里面的,所有为英文显示。
源码下载:demosharpmap.rar
总结
以上所述是小编给大家介绍的c# 中sharpmap的简单使用实例详解,希望对大家有所帮助,如果大家有任何疑问请给我留言,小编会及时回复大家的。在此也非常感谢大家对服务器之家网站的支持!
原文链接:http://www.cnblogs.com/hsiang/archive/2017/08/27/7440950.html


