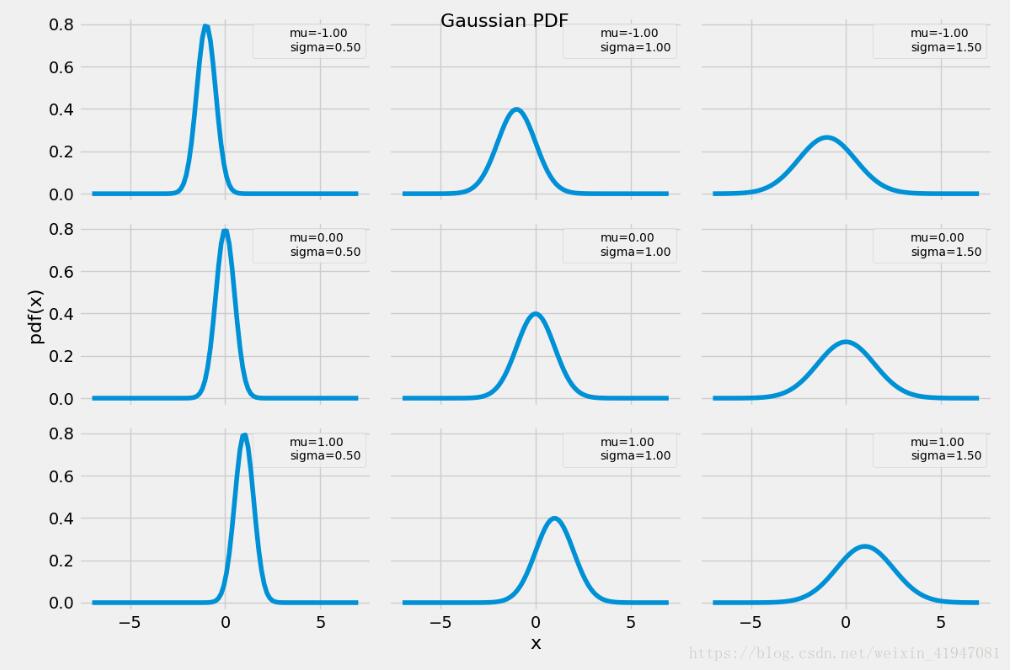
如下所示:
|
1
2
3
4
5
6
7
8
9
10
11
12
13
14
15
16
17
18
19
20
21
22
|
import matplotlib.pyplot as pltimport numpy as npfrom scipy import statsfrom matplotlib import stylestyle.use('fivethirtyeight')mu_params = [-1, 0, 1]sd_params = [0.5, 1, 1.5]x = np.linspace(-7, 7, 100)f, ax = plt.subplots(len(mu_params), len(sd_params), sharex=True, sharey=True, figsize=(12,8))for i in range(3): for j in range(3): mu = mu_params[i] sd = sd_params[j] y = stats.norm(mu, sd).pdf(x) ax[i, j].plot(x, y) ax[i, j].plot(0,0, label='mu={:3.2f}\nsigma={:3.2f}'.format(mu,sd), alpha=0) ax[i, j].legend(fontsize=10)ax[2,1].set_xlabel('x', fontsize=16)ax[1,0].set_ylabel('pdf(x)', fontsize=16)plt.suptitle('Gaussian PDF', fontsize=16)plt.tight_layout()plt.show() |

以上这篇python高斯分布概率密度函数的使用详解就是小编分享给大家的全部内容了,希望能给大家一个参考,也希望大家多多支持服务器之家。
原文链接:https://blog.csdn.net/weixin_41947081/article/details/81105222


