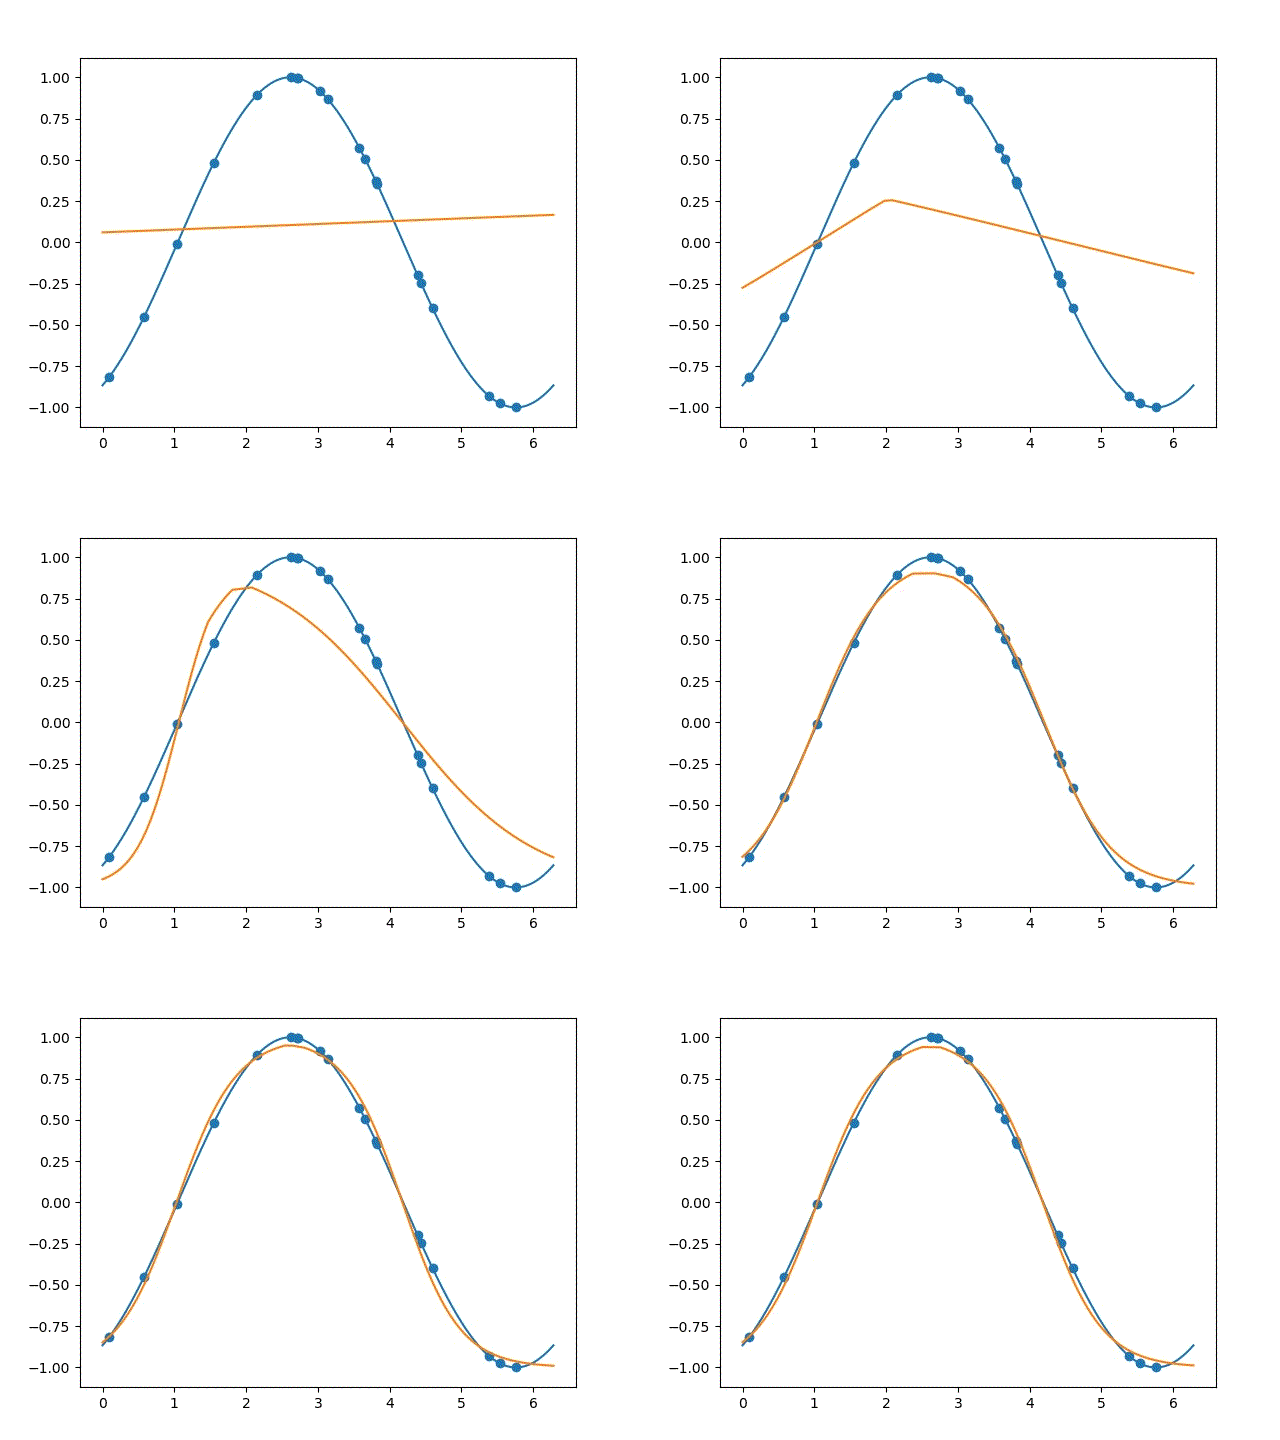
1.matplotlib动态绘图
python在绘图的时候,需要开启 interactive mode。核心代码如下:
|
1
2
3
4
5
6
7
8
9
10
11
12
13
14
15
16
17
18
19
20
21
22
23
24
|
plt.ion(); #开启interactive mode 成功的关键函数 fig = plt.figure(1); for i in range(100): filepath="e:/model/weights-improvement-" + str(i + 1) + ".hdf5"; model.load_weights(filepath); #测试数据 x_new = np.linspace(low, up, 1000); y_new = getfit(model,x_new); # 显示数据 plt.clf(); plt.plot(x,y); plt.scatter(x_sample, y_sample); plt.plot(x_new,y_new); ffpath = "e:/imgs/" + str(i) + ".jpg"; plt.savefig(ffpath); plt.pause(0.01) # 暂停0.01秒 ani = animation.funcanimation(plt.figure(2), update,range(100),init_func=init, interval=500); ani.save("e:/test.gif",writer='pillow'); plt.ioff() # 关闭交互模式 |
2.实例
已知下面采样自sin函数的数据:
| x | y | |
| 1 | 0.093 | -0.81 |
| 2 | 0.58 | -0.45 |
| 3 | 1.04 | -0.007 |
| 4 | 1.55 | 0.48 |
| 5 | 2.15 | 0.89 |
| 6 | 2.62 | 0.997 |
| 7 | 2.71 | 0.995 |
| 8 | 2.73 | 0.993 |
| 9 | 3.03 | 0.916 |
| 10 | 3.14 | 0.86 |
| 11 | 3.58 | 0.57 |
| 12 | 3.66 | 0.504 |
| 13 | 3.81 | 0.369 |
| 14 | 3.83 | 0.35 |
| 15 | 4.39 | -0.199 |
| 16 | 4.44 | -0.248 |
| 17 | 4.6 | -0.399 |
| 18 | 5.39 | -0.932 |
| 19 | 5.54 | -0.975 |
| 20 | 5.76 | -0.999 |
通过一个简单的三层神经网络训练一个sin函数的拟合器,并可视化模型训练过程的拟合曲线。

2.1 网络训练实现
主要做的事情是定义一个三层的神经网络,输入层节点数为1,隐藏层节点数为10,输出层节点数为1。
|
1
2
3
4
5
6
7
8
9
10
11
12
13
14
15
16
17
18
19
20
21
22
23
24
25
26
27
28
29
30
31
32
33
34
35
36
37
38
39
40
41
42
43
44
45
46
47
48
49
50
51
52
53
54
55
56
57
58
59
60
61
62
63
64
65
66
67
68
69
70
71
72
73
74
75
76
77
78
79
80
81
82
83
84
|
import math;import random;from matplotlib import pyplot as pltfrom keras.models import sequentialfrom keras.layers.core import densefrom keras.optimizers import adamimport numpy as npfrom keras.callbacks import modelcheckpointimport os #采样函数def sample(low, up, num): data = []; for i in range(num): #采样 tmp = random.uniform(low, up); data.append(tmp); data.sort(); return data; #sin函数def func(x): y = []; for i in range(len(x)): tmp = math.sin(x[i] - math.pi/3); y.append(tmp); return y; #获取模型拟合结果def getfit(model,x): y = []; for i in range(len(x)): tmp = model.predict([x[i]], 10); y.append(tmp[0][0]); return y; #删除同一目录下的所有文件def del_file(path): ls = os.listdir(path) for i in ls: c_path = os.path.join(path, i) if os.path.isdir(c_path): del_file(c_path) else: os.remove(c_path) if __name__ == '__main__': path = "e:/model/"; del_file(path); low = 0; up = 2 * math.pi; x = np.linspace(low, up, 1000); y = func(x); # 数据采样# x_sample = sample(low,up,20); x_sample = [0.09326442022999694, 0.5812590520508311, 1.040490143783586, 1.5504427746047338, 2.1589557183817036, 2.6235357787018407, 2.712578091093361, 2.7379109336528167, 3.0339662651841186, 3.147676812083248, 3.58596337171837, 3.6621496731124314, 3.81130899864203, 3.833092859928872, 4.396611340802901, 4.4481080339256875, 4.609657879057151, 5.399731063412583, 5.54299720786794, 5.764084730699906]; y_sample = func(x_sample); # callback filepath="e:/model/weights-improvement-{epoch:00d}.hdf5"; checkpoint= modelcheckpoint(filepath, verbose=1, save_best_only=false, mode='max'); callbacks_list= [checkpoint]; # 建立顺序神经网络层次模型 model = sequential(); model.add(dense(10, input_dim=1, init='uniform', activation='relu')); model.add(dense(1, init='uniform', activation='tanh')); adam = adam(lr = 0.05); model.compile(loss='mean_squared_error', optimizer=adam, metrics=['accuracy']); model.fit(x_sample, y_sample, nb_epoch=1000, batch_size=20,callbacks=callbacks_list); #测试数据 x_new = np.linspace(low, up, 1000); y_new = getfit(model,x_new); # 数据可视化 plt.plot(x,y); plt.scatter(x_sample, y_sample); plt.plot(x_new,y_new); plt.show(); |
2.2 模型保存
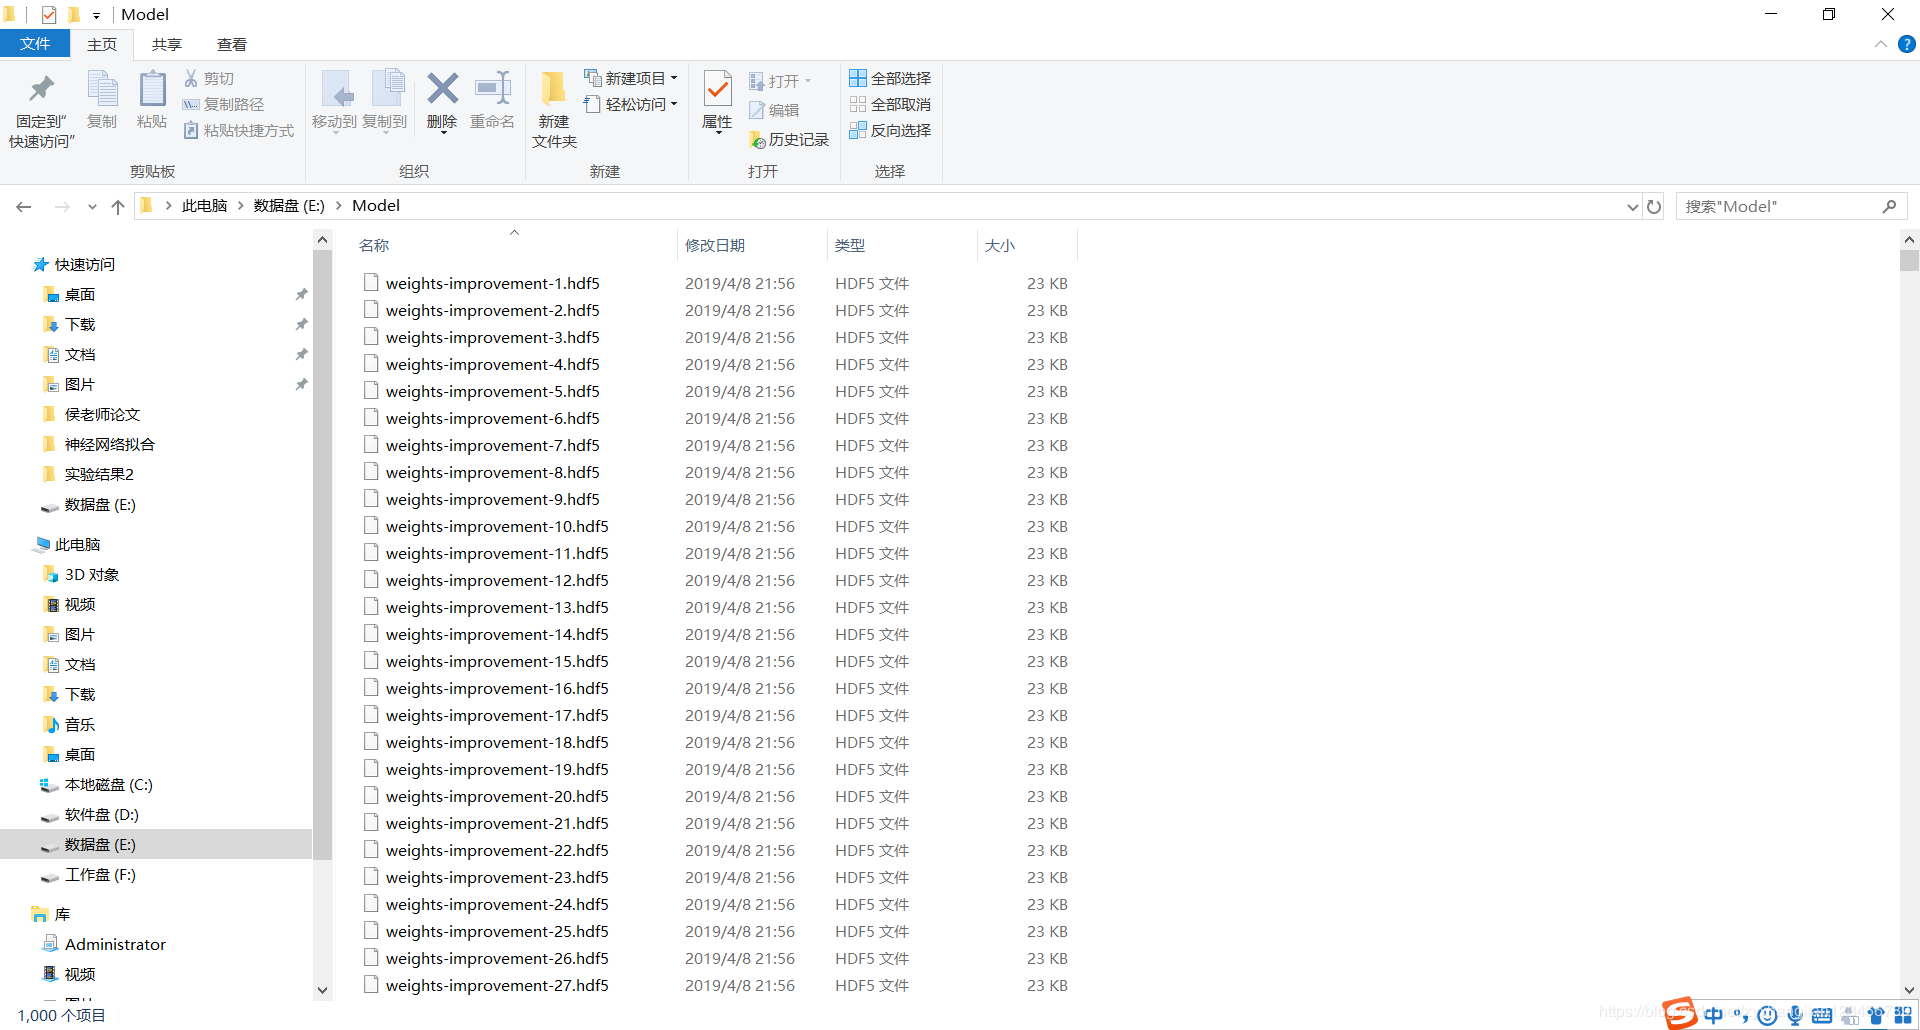
在神经网络训练的过程中,有一个非常重要的操作,就是将训练过程中模型的参数保存到本地,这是后面拟合过程可视化的基础。训练过程中保存的模型文件,如下图所示。

模型保存的关键在于fit函数中callback函数的设置,注意到,下面的代码,每次迭代,算法都会执行callbacks函数指定的函数列表中的方法。这里,我们的回调函数设置为modelcheckpoint,其参数如下表所示:
| 参数 | 含义 |
| filename | 字符串,保存模型的路径 |
| verbose |
信息展示模式,0或1 (epoch 00001: saving model to ...) |
| mode | ‘auto',‘min',‘max' |
| monitor | 需要监视的值 |
| save_best_only | 当设置为true时,监测值有改进时才会保存当前的模型。在save_best_only=true时决定性能最佳模型的评判准则,例如,当监测值为val_acc时,模式应为max,当监测值为val_loss时,模式应为min。在auto模式下,评价准则由被监测值的名字自动推断 |
| save_weights_only | 若设置为true,则只保存模型权重,否则将保存整个模型(包括模型结构,配置信息等) |
| period | checkpoint之间的间隔的epoch数 |
|
1
2
3
4
5
6
7
8
9
10
11
12
|
# callback filepath="e:/model/weights-improvement-{epoch:00d}.hdf5"; checkpoint= modelcheckpoint(filepath, verbose=1, save_best_only=false, mode='max'); callbacks_list= [checkpoint]; # 建立顺序神经网络层次模型 model = sequential(); model.add(dense(10, input_dim=1, init='uniform', activation='relu')); model.add(dense(1, init='uniform', activation='tanh')); adam = adam(lr = 0.05); model.compile(loss='mean_squared_error', optimizer=adam, metrics=['accuracy']); model.fit(x_sample, y_sample, nb_epoch=1000, batch_size=20,callbacks=callbacks_list); |
2.3 拟合过程可视化实现
利用上述保存的模型,我们就可以通过matplotlib实时地显示拟合过程。
|
1
2
3
4
5
6
7
8
9
10
11
12
13
14
15
16
17
18
19
20
21
22
23
24
25
26
27
28
29
30
31
32
33
34
35
36
37
38
39
40
41
42
43
44
45
46
47
48
49
50
51
52
53
54
55
56
57
58
59
60
61
62
63
64
65
66
67
68
69
70
71
72
73
74
75
76
77
78
79
80
81
82
83
84
85
|
import math;import random;from matplotlib import pyplot as pltfrom keras.models import sequentialfrom keras.layers.core import denseimport numpy as npimport matplotlib.animation as animationfrom pil import image #定义kdd99数据预处理函数def sample(low, up, num): data = []; for i in range(num): #采样 tmp = random.uniform(low, up); data.append(tmp); data.sort(); return data; def func(x): y = []; for i in range(len(x)): tmp = math.sin(x[i] - math.pi/3); y.append(tmp); return y; def getfit(model,x): y = []; for i in range(len(x)): tmp = model.predict([x[i]], 10); y.append(tmp[0][0]); return y; def init(): fpath = "e:/imgs/0.jpg"; img = image.open(fpath); plt.axis('off') # 关掉坐标轴为 off return plt.imshow(img); def update(i): fpath = "e:/imgs/" + str(i) + ".jpg"; img = image.open(fpath); plt.axis('off') # 关掉坐标轴为 off return plt.imshow(img); if __name__ == '__main__': low = 0; up = 2 * math.pi; x = np.linspace(low, up, 1000); y = func(x); # 数据采样# x_sample = sample(low,up,20); x_sample = [0.09326442022999694, 0.5812590520508311, 1.040490143783586, 1.5504427746047338, 2.1589557183817036, 2.6235357787018407, 2.712578091093361, 2.7379109336528167, 3.0339662651841186, 3.147676812083248, 3.58596337171837, 3.6621496731124314, 3.81130899864203, 3.833092859928872, 4.396611340802901, 4.4481080339256875, 4.609657879057151, 5.399731063412583, 5.54299720786794, 5.764084730699906]; y_sample = func(x_sample); # 建立顺序神经网络层次模型 model = sequential(); model.add(dense(10, input_dim=1, init='uniform', activation='relu')); model.add(dense(1, init='uniform', activation='tanh')); plt.ion(); #开启interactive mode 成功的关键函数 fig = plt.figure(1); for i in range(100): filepath="e:/model/weights-improvement-" + str(i + 1) + ".hdf5"; model.load_weights(filepath); #测试数据 x_new = np.linspace(low, up, 1000); y_new = getfit(model,x_new); # 显示数据 plt.clf(); plt.plot(x,y); plt.scatter(x_sample, y_sample); plt.plot(x_new,y_new); ffpath = "e:/imgs/" + str(i) + ".jpg"; plt.savefig(ffpath); plt.pause(0.01) # 暂停0.01秒 ani = animation.funcanimation(plt.figure(2), update,range(100),init_func=init, interval=500); ani.save("e:/test.gif",writer='pillow'); plt.ioff() |

以上所述是小编给大家介绍的matplotlib动态显示详解整合,希望对大家有所帮助,如果大家有任何疑问请给我留言,小编会及时回复大家的。在此也非常感谢大家对服务器之家网站的支持!
原文链接:https://blog.csdn.net/zyxhangiian123456789/article/details/89159530


