前言
ios端画图表的库很多,今天给大家介绍一款很有名的库 - charts
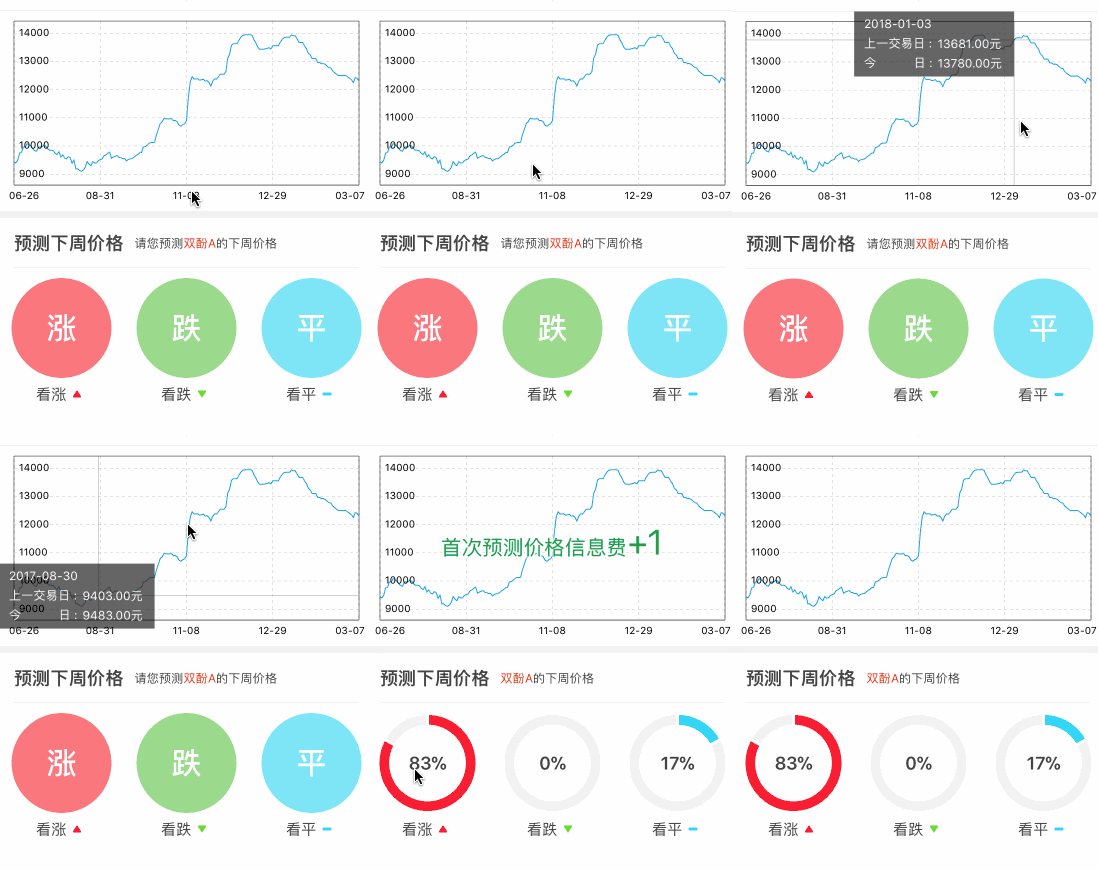
借助charts,我们可以画出很精美的折线图、柱状图、饼状图、k线、雷达、混合图表等等
1.集成charts
这里只是做一个简略说明,具体的可以参考官方的集成方法 charts
如果使用的swift开发,可以直接import charts
如果使用oc开发,则需要混编,建立projectname-bridging-header.h桥接文件,这里详细介绍混编开发
- 利用cocoapods,在podfile文件中写入 : pod 'charts',然后pod install
- 在桥接文件中@import charts;
- 在需要使用charts的文件中,#import "projectname-bridging-header.h",就可以使用charts中的代码了
2.折线图
|
1
2
3
4
5
6
7
8
9
10
11
12
13
14
15
16
17
18
19
20
21
22
23
24
25
26
27
28
29
30
31
32
33
34
35
36
37
38
39
40
41
42
43
44
45
46
47
48
49
50
51
52
53
54
55
56
57
58
59
60
61
62
63
64
65
66
67
68
69
70
71
72
73
|
//初始化折线图- (linechartview *)linechartview{ if(!_linechartview){ _linechartview = [[linechartview alloc] initwithframe:cgrectzero]; [_linechartview setextraoffsetswithleft:15 top:0 right:15 bottom:10];//距离边缘的间隙 _linechartview.delegate = self;//设置代理 _linechartview.backgroundcolor = [uicolor whitecolor]; _linechartview.nodatatext = @"暂无此产品的价格趋势"; _linechartview.nodatafont = [uifont systemfontofsize:15]; _linechartview.nodatatextcolor = hexcolor(0x444444); _linechartview.chartdescription.enabled = yes; _linechartview.scaleyenabled = no;//取消y轴缩放 _linechartview.scalexenabled = no;//取消x轴缩放 _linechartview.doubletaptozoomenabled = no;//取消双击缩放 _linechartview.dragenabled = yes;//启用拖拽 _linechartview.dragdecelerationenabled = yes;//拖拽后是否有惯性效果 _linechartview.dragdecelerationfrictioncoef = 0.9;//拖拽后惯性效果的摩擦系数(0~1),数值越小,惯性越不明显 //描述及图例样式 [_linechartview setdescriptiontext:@""]; _linechartview.legend.enabled = no; //设置左侧y轴 _linechartview.rightaxis.enabled = yes;//绘制右边轴 chartyaxis *leftaxis = _linechartview.leftaxis;//获取左边y轴 leftaxis.labelcount = 5;//y轴label数量,数值不一定,如果forcelabelsenabled等于yes, 则强制绘制制定数量的label, 但是可能不平均 leftaxis.forcelabelsenabled = no;//不强制绘制指定数量的labe leftaxis.axislinewidth = 0.6; //设置y轴线宽 leftaxis.axislinecolor = [uicolor blackcolor]; //设置y轴颜色 // leftaxis.axisminvalue = 0;//设置y轴的最小值 //leftaxis.axismaxvalue = 105;//设置y轴的最大值 leftaxis.inverted = no;//是否将y轴进行上下翻转 leftaxis.axislinecolor = [uicolor blackcolor];//y轴颜色 leftaxis.labelposition = yaxislabelpositioninsidechart;//label位置 leftaxis.labeltextcolor = [uicolor blackcolor];//文字颜色 leftaxis.labelfont = [uifont systemfontofsize:10.0f];//文字字体 //leftaxis.valueformatter = [[symbolsvalueformatter alloc]init];//设置y轴的数据格式 leftaxis.gridlinedashlengths = @[@3.0f, @3.0f];//设置虚线样式的网格线 leftaxis.gridcolor = [uicolor colorwithred:200/255.0f green:200/255.0f blue:200/255.0f alpha:1];//网格线颜色 leftaxis.gridantialiasenabled = yes;//开启抗锯齿 //设置z轴 chartyaxis *rightaxis = _linechartview.rightaxis;//获取右边z轴 rightaxis.axislinewidth = 0.6; rightaxis.axislinecolor = [uicolor blackcolor];//z轴颜色 rightaxis.drawgridlinesenabled = no; rightaxis.drawlabelsenabled = no; //设置x轴 chartxaxis *xaxis = _linechartview.xaxis; xaxis.valueformatter = self; //这里才是最最最最最最关键的代码 xaxis.granularityenabled = yes;//设置重复的值不显示 xaxis.labelcount = 5; xaxis.spacemin = 0; //设置坐标轴额外的最小空间 xaxis.forcelabelsenabled = yes; xaxis.labelposition = xaxislabelpositionbottom;//设置x轴数据在底部 xaxis.labeltextcolor = [uicolor blackcolor];//文字颜色 xaxis.axislinewidth = 0.6; xaxis.axislinecolor = [uicolor blackcolor]; //x轴的颜色 xaxis.gridlinedashlengths = @[@3.0f, @3.0f];//设置虚线样式的网格线 xaxis.gridcolor = [uicolor colorwithred:200/255.0f green:200/255.0f blue:200/255.0f alpha:1];//网格线颜色 xaxis.gridantialiasenabled = yes;//开启抗锯齿 //_linechartview.maxvisiblecount = 999;//设置能够显示的数据数量 //设置浮层 _linechartview.drawmarkers = yes; chartmarkerview * makerview = [[chartmarkerview alloc]init]; makerview.offset = cgpointmake(-self.subpriceview.frame.size.width,-self.subpriceview.frame.size.height/2); makerview.chartview = _linechartview; _linechartview.marker = makerview; [makerview addsubview:self.subpriceview]; } return _linechartview;} |
|
1
2
3
4
5
6
7
8
9
10
11
12
13
14
15
16
17
18
19
20
21
22
23
24
25
26
27
28
29
30
31
32
33
34
35
36
37
38
39
40
41
42
43
44
45
46
47
48
49
|
//折线图的数据源- (linechartdata *)getlinedata{ if(self.pricetrenddatasource.count == 0) return nil; //x轴上面需要显示的数据 nsmutablearray *xvals = [nsmutablearray array]; //对应y轴上面需要显示的数据,价格 nsmutablearray *yvals = [nsmutablearray array]; nsinteger index = 0; for (pricetrendmodel * model in self.pricetrenddatasource) { [xvals addobject:[nsstring stringwithformat:@"%@",model.trend_x]]; chartdataentry *entry_y = [[chartdataentry alloc] initwithx:index y:model.trend_y]; [yvals addobject:entry_y]; index ++; } linechartdataset *lineset = [[linechartdataset alloc] initwithvalues:yvals label:@""]; lineset.mode = linechartmodecubicbezier; lineset.linewidth = 1.0f; lineset.drawvaluesenabled = no; lineset.valuecolors = @[[uicolor purplecolor]]; //折线上的数值的颜色 [lineset setcolor:hexcolor(0x24a5ea)]; //折线本身的颜色 lineset.drawsteppedenabled = no;//是否开启绘制阶梯样式的折线图 lineset.drawcirclesenabled = no; lineset.drawfilledenabled = no;//是否填充颜色 lineset.circleradius = 1.0f; lineset.drawcircleholeenabled = no; lineset.circleholeradius = 0.0f; lineset.circleholecolor = [uicolor whitecolor]; lineset.highlightenabled = yes;//选中拐点,是否开启高亮效果(显示十字线) //lineset.highlightcolor = hexcolor(0xc83c23);//点击选中拐点的十字线的颜色 lineset.highlightcolor = [hexcolor(0x444444) colorwithalphacomponent:0.5];//点击选中拐点的十字线的颜色 lineset.highlightlinewidth = 0.5;//十字线宽度 //lineset.highlightlinedashlengths = @[@5,@5]; //设置十字线的虚线宽度 lineset.valuefont = [uifont systemfontofsize:12]; lineset.axisdependency = axisdependencyleft; linechartdata *linedata = [[linechartdata alloc] initwithdataset:lineset]; return linedata;} |
3.饼状图
|
1
2
3
4
5
6
7
8
9
10
11
12
13
14
15
16
17
18
19
20
21
22
23
24
25
26
27
28
29
30
31
32
33
34
35
36
37
38
39
40
41
42
43
44
45
46
47
48
49
50
51
52
53
54
55
|
//初始化饼状图- (piechartview *)piechartview{ if (!_piechartview) { _piechartview = [[piechartview alloc] initwithframe:cgrectzero]; _piechartview.backgroundcolor = [uicolor whitecolor]; //基本样式 //[_piechartview setextraoffsetswithleft:30 top:10 right:30 bottom:10];//饼状图距离边缘的间隙 [_piechartview setextraoffsetswithleft:0 top:0 right:0 bottom:0];//饼状图距离边缘的间隙 _piechartview.usepercentvaluesenabled = no;//是否根据所提供的数据, 将显示数据转换为百分比格式 _piechartview.dragdecelerationenabled = yes;//拖拽饼状图后是否有惯性效果 _piechartview.drawslicetextenabled = no;//是否显示区块文本 //空心样式 _piechartview.drawholeenabled = yes;//饼状图是否是空心 _piechartview.holeradiuspercent = 0.8;//空心半径占比 _piechartview.holecolor = [uicolor clearcolor];//空心颜色 _piechartview.transparentcircleradiuspercent = 0.52;//半透明空心半径占比 _piechartview.transparentcirclecolor = [uicolor colorwithred:210/255.0 green:145/255.0 blue:165/255.0 alpha:0.3];//半透明空心的颜色 //设置空心文字 if (_piechartview.isdrawholeenabled == yes) { _piechartview.drawcentertextenabled = yes;//是否显示中间文字 //普通文本 //_piechartview.centertext = @"资产";//中间文字 //富文本 nsmutableattributedstring *centertext = [[nsmutableattributedstring alloc] initwithstring:@"收支详情"]; [centertext setattributes:@{nsfontattributename: [uifont boldsystemfontofsize:18], nsforegroundcolorattributename: hexcolor(0x444444)} range:nsmakerange(0, centertext.length)]; _piechartview.centerattributedtext = centertext; } //设置饼状图描述 _piechartview.descriptiontext = @""; //_piechartview.descriptionfont = [uifont systemfontofsize:10]; //_piechartview.descriptiontextcolor = [uicolor graycolor]; //设置图例样式 _piechartview.legend.maxsizepercent = 0;//图例在饼状图中的大小占比, 这会影响图例的宽高 _piechartview.legend.formtotextspace = 5;//文本间隔 _piechartview.legend.yentryspace = 12;//10; _piechartview.legend.xentryspace = 15; _piechartview.legend.font = [uifont systemfontofsize:10];//字体大小 _piechartview.legend.textcolor = [uicolor graycolor];//字体颜色 _piechartview.legend.position = chartlegendpositionbelowchartcenter;//图例在饼状图中的位置 _piechartview.legend.form = chartlegendformcircle;//图示样式: 方形、线条、圆形 _piechartview.legend.formsize = 0;//图示大小 } return _piechartview;} |
|
1
2
3
4
5
6
7
8
9
10
11
12
13
14
15
16
17
18
19
20
21
22
23
24
25
26
27
28
29
30
31
32
33
34
35
36
37
38
39
40
41
42
43
44
45
46
47
48
49
50
51
52
53
54
55
56
57
58
59
60
61
62
63
64
65
66
67
68
69
70
71
72
73
74
75
76
77
78
79
80
81
82
83
84
85
86
87
88
89
90
|
//饼状图的数据源- (piechartdata *)getpiedata{ //每个区块的金额数 nsmutablearray * moneyarray = [nsmutablearray arraywitharray:@[@33.33,@66.66]]; //每个区块的名称或描述 //nsarray * xvals = @[@"充值诚意金",@"充值会员费",@"赠送诚意金",@"赠送会员费",@"被冻结资金"];// nsmutablearray * xvals = [nsmutablearray array]; //每个区块的颜色 nsmutablearray *colors = [[nsmutablearray alloc] init]; switch (_forecasttype) { case forecastpricetypeup:{ [colors addobject:hexcolor(0xff1f32)]; [moneyarray removeallobjects]; [moneyarray addobject:@(self.forecastmodel.uprate)]; [moneyarray addobject:@(1 - self.forecastmodel.uprate)]; break; } case forecastpricetypedown:{ [colors addobject:hexcolor(0x5fd954)]; [moneyarray removeallobjects]; [moneyarray addobject:@(self.forecastmodel.downrate)]; [moneyarray addobject:@(1 - self.forecastmodel.downrate)]; break; } case forecastpricetypelevel:{ [colors addobject:hexcolor(0x00d6f6)]; [moneyarray removeallobjects]; [moneyarray addobject:@(self.forecastmodel.rate)]; [moneyarray addobject:@(1 - self.forecastmodel.rate)]; break; } default: break; } [colors addobject:hexcolor(0xf2f2f2)]; //每个区块的数据 nsmutablearray *yvals = [[nsmutablearray alloc] init]; for (int i = 0; i < moneyarray.count; i++) { double randomval = [moneyarray[i] doublevalue]; //barchartdataentry *entry = [[barchartdataentry alloc] initwithvalue:randomval xindex:i]; //chartdataentry * entry = [[chartdataentry alloc] initwithvalue:randomval xindex:i]; chartdataentry * entry = [[chartdataentry alloc] initwithx:i y:randomval]; [yvals addobject:entry]; } //dataset //piechartdataset *dataset = [[piechartdataset alloc] initwithyvals:yvals label:@""]; piechartdataset *dataset = [[piechartdataset alloc] initwithvalues:yvals label:@""]; dataset.drawvaluesenabled = no;//是否绘制显示数据 dataset.colors = colors;//区块颜色 dataset.slicespace = 3;//相邻区块之间的间距 dataset.selectionshift = 2;//选中区块时, 放大的半径 dataset.xvalueposition = piechartvaluepositioninsideslice;//名称位置 dataset.yvalueposition = piechartvaluepositionoutsideslice;//数据位置 //数据与区块之间的用于指示的折线样式 dataset.valuelinepart1offsetpercentage = 0.85;//折线中第一段起始位置相对于区块的偏移量, 数值越大, 折线距离区块越远 dataset.valuelinepart1length = 0.5;//折线中第一段长度占比 dataset.valuelinepart2length = 0.4;//折线中第二段长度最大占比 dataset.valuelinewidth = 1;//折线的粗细 dataset.valuelinecolor = [uicolor browncolor];//折线颜色 dataset.valuelinevariablelength = yes; //data //piechartdata *data = [[piechartdata alloc] initwithxvals:xvals dataset:dataset]; piechartdata *data = [[piechartdata alloc] initwithdataset:dataset]; nsnumberformatter *formatter = [[nsnumberformatter alloc] init]; formatter.numberstyle = kcfnumberformatterdecimalstyle;//nsnumberformatterpercentstyle; [formatter setpositiveformat:@"###,##0.00;"]; formatter.maximumfractiondigits = 2;//小数位数 formatter.multiplier = @1.f; formatter.paddingposition = kcfnumberformatterpadbeforesuffix; formatter.positivesuffix = @"元"; //[data setvalueformatter:formatter];//设置显示数据格式 [data setvaluetextcolor:[uicolor browncolor]]; [data setvaluefont:[uifont systemfontofsize:10]]; return data;} |
总结
以上就是这篇文章的全部内容了,希望本文的内容对大家的学习或者工作具有一定的参考学习价值,如果有疑问大家可以留言交流,谢谢大家对服务器之家的支持。
原文链接:https://www.jianshu.com/p/dca81729531f


