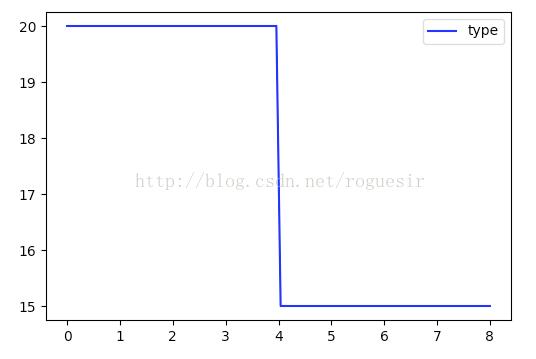
本文实例为大家分享了python使用Matplotlib绘制分段函数的具体代码,供大家参考,具体内容如下
环境
Python3
Mac OS
代码
|
1
2
3
4
5
6
7
8
9
10
11
12
13
14
15
16
17
18
19
20
21
22
23
24
25
|
# coding:utf-8 """Author: roguesirDate: 2017/8/30GitHub: https://roguesir.github.comBlog: http://blog.csdn.net/roguesir""" import numpy as npimport matplotlib.pyplot as plt def sgn(value): if value < 4: return 20 else: return 15plt.figure(figsize=(6,4))x = np.linspace(0, 8, 100)y = np.array([])for v in x: y = np.append(y,np.linspace(sgn(v),sgn(v),1))l=plt.plot(x,y,'b',label='type')plt.legend()plt.show() |
输出

以上就是本文的全部内容,希望对大家的学习有所帮助,也希望大家多多支持服务器之家。
原文链接:https://blog.csdn.net/roguesir/article/details/77839438


