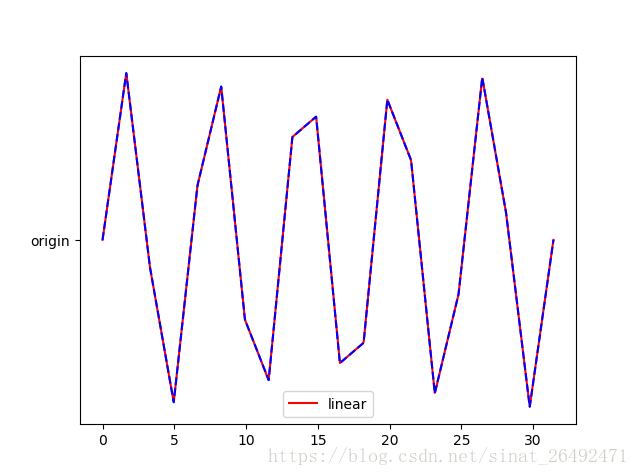
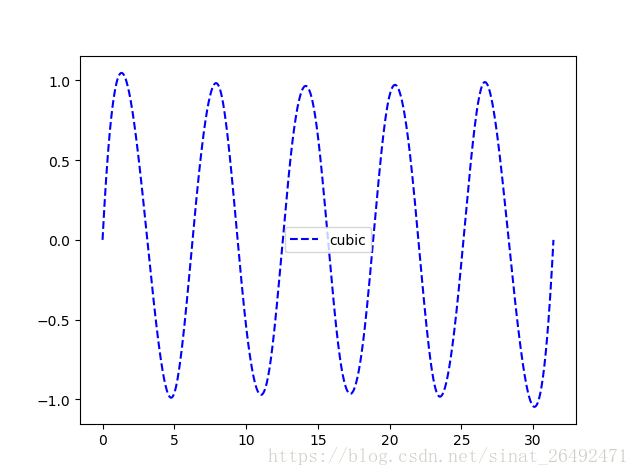
具体代码如下所示:
|
1
2
3
4
5
6
7
8
9
10
11
12
13
14
15
16
17
18
19
|
import numpy as npfrom matplotlib import pyplot as pltx=np.linspace(0,10*np.pi,num=20)y=np.sin(x)f2=interp1d(x,y,kind='cubic')#三次样条插值x_pred=np.linspace(0,10*np.pi,num=1000)y1=f1(x_pred)y2=f2(x_pred)plt.figure()plt.plot(x_pred,y1,'r',label='linear')plt.plot(x,f1(x),'b--','origin')plt.legend()plt.show()plt.figure()plt.plot(x_pred,y2,'b--',label='cubic')plt.legend()plt.show() |


总结
以上所述是小编给大家介绍的python中的插值 scipy-interp的实现代码,希望对大家有所帮助,如果大家有任何疑问请给我留言,小编会及时回复大家的。在此也非常感谢大家对服务器之家网站的支持!
原文链接:https://blog.csdn.net/sinat_26492471/article/details/81164803


