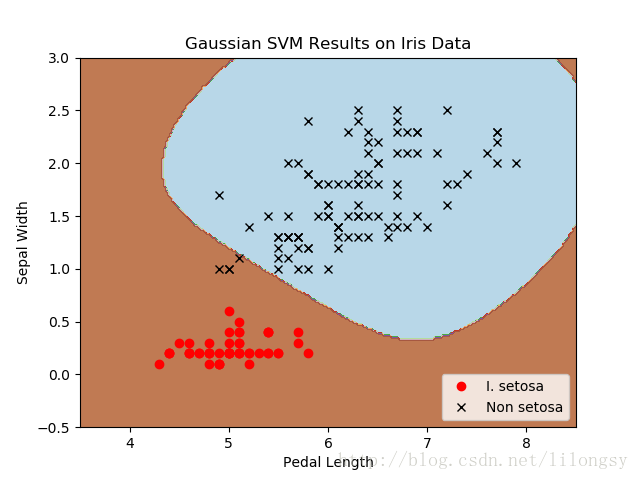
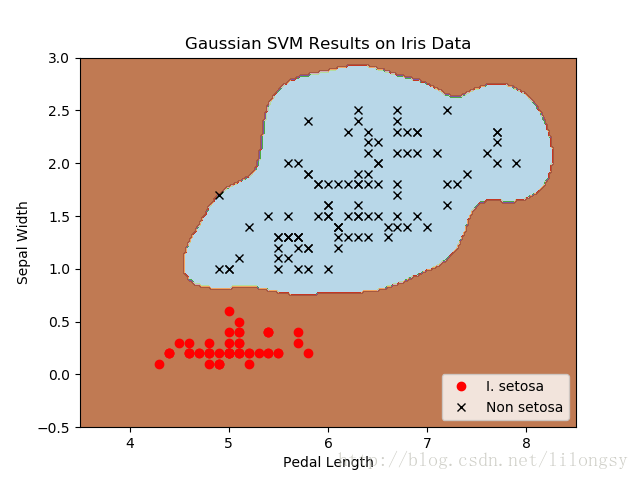
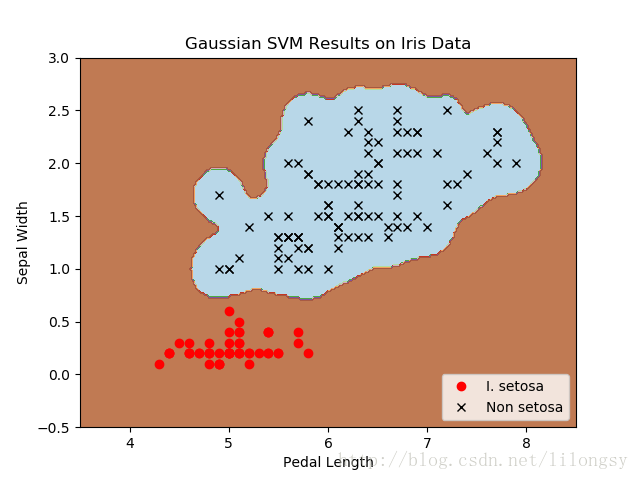
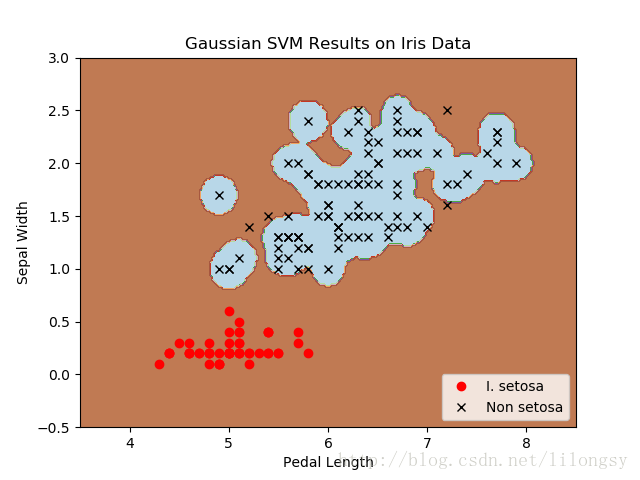
这里将加载iris数据集,创建一个山鸢尾花(i.setosa)的分类器。
|
1
2
3
4
5
6
7
8
9
10
11
12
13
14
15
16
17
18
19
20
21
22
23
24
25
26
27
28
29
30
31
32
33
34
35
36
37
38
39
40
41
42
43
44
45
46
47
48
49
50
51
52
53
54
55
56
57
58
59
60
61
62
63
64
65
66
67
68
69
70
71
72
73
74
75
76
77
78
79
80
81
82
83
84
85
86
87
88
89
90
91
92
93
94
95
96
97
98
99
100
101
102
103
104
105
106
107
108
109
110
111
112
113
114
115
116
117
118
119
120
121
122
123
124
125
126
127
128
129
130
131
132
133
134
135
|
# nonlinear svm example#----------------------------------## this function wll illustrate how to# implement the gaussian kernel on# the iris dataset.## gaussian kernel:# k(x1, x2) = exp(-gamma * abs(x1 - x2)^2)import matplotlib.pyplot as pltimport numpy as npimport tensorflow as tffrom sklearn import datasetsfrom tensorflow.python.framework import opsops.reset_default_graph()# create graphsess = tf.session()# load the data# iris.data = [(sepal length, sepal width, petal length, petal width)]# 加载iris数据集,抽取花萼长度和花瓣宽度,分割每类的x_vals值和y_vals值iris = datasets.load_iris()x_vals = np.array([[x[0], x[3]] for x in iris.data])y_vals = np.array([1 if y==0 else -1 for y in iris.target])class1_x = [x[0] for i,x in enumerate(x_vals) if y_vals[i]==1]class1_y = [x[1] for i,x in enumerate(x_vals) if y_vals[i]==1]class2_x = [x[0] for i,x in enumerate(x_vals) if y_vals[i]==-1]class2_y = [x[1] for i,x in enumerate(x_vals) if y_vals[i]==-1]# declare batch size# 声明批量大小(偏向于更大批量大小)batch_size = 150# initialize placeholdersx_data = tf.placeholder(shape=[none, 2], dtype=tf.float32)y_target = tf.placeholder(shape=[none, 1], dtype=tf.float32)prediction_grid = tf.placeholder(shape=[none, 2], dtype=tf.float32)# create variables for svmb = tf.variable(tf.random_normal(shape=[1,batch_size]))# gaussian (rbf) kernel# 声明批量大小(偏向于更大批量大小)gamma = tf.constant(-25.0)sq_dists = tf.multiply(2., tf.matmul(x_data, tf.transpose(x_data)))my_kernel = tf.exp(tf.multiply(gamma, tf.abs(sq_dists)))# compute svm modelfirst_term = tf.reduce_sum(b)b_vec_cross = tf.matmul(tf.transpose(b), b)y_target_cross = tf.matmul(y_target, tf.transpose(y_target))second_term = tf.reduce_sum(tf.multiply(my_kernel, tf.multiply(b_vec_cross, y_target_cross)))loss = tf.negative(tf.subtract(first_term, second_term))# gaussian (rbf) prediction kernel# 创建一个预测核函数ra = tf.reshape(tf.reduce_sum(tf.square(x_data), 1),[-1,1])rb = tf.reshape(tf.reduce_sum(tf.square(prediction_grid), 1),[-1,1])pred_sq_dist = tf.add(tf.subtract(ra, tf.multiply(2., tf.matmul(x_data, tf.transpose(prediction_grid)))), tf.transpose(rb))pred_kernel = tf.exp(tf.multiply(gamma, tf.abs(pred_sq_dist)))# 声明一个准确度函数,其为正确分类的数据点的百分比prediction_output = tf.matmul(tf.multiply(tf.transpose(y_target),b), pred_kernel)prediction = tf.sign(prediction_output-tf.reduce_mean(prediction_output))accuracy = tf.reduce_mean(tf.cast(tf.equal(tf.squeeze(prediction), tf.squeeze(y_target)), tf.float32))# declare optimizermy_opt = tf.train.gradientdescentoptimizer(0.01)train_step = my_opt.minimize(loss)# initialize variablesinit = tf.global_variables_initializer()sess.run(init)# training looploss_vec = []batch_accuracy = []for i in range(300): rand_index = np.random.choice(len(x_vals), size=batch_size) rand_x = x_vals[rand_index] rand_y = np.transpose([y_vals[rand_index]]) sess.run(train_step, feed_dict={x_data: rand_x, y_target: rand_y}) temp_loss = sess.run(loss, feed_dict={x_data: rand_x, y_target: rand_y}) loss_vec.append(temp_loss) acc_temp = sess.run(accuracy, feed_dict={x_data: rand_x, y_target: rand_y, prediction_grid:rand_x}) batch_accuracy.append(acc_temp) if (i+1)%75==0: print('step #' + str(i+1)) print('loss = ' + str(temp_loss))# create a mesh to plot points in# 为了绘制决策边界(decision boundary),我们创建一个数据点(x,y)的网格,评估预测函数x_min, x_max = x_vals[:, 0].min() - 1, x_vals[:, 0].max() + 1y_min, y_max = x_vals[:, 1].min() - 1, x_vals[:, 1].max() + 1xx, yy = np.meshgrid(np.arange(x_min, x_max, 0.02), np.arange(y_min, y_max, 0.02))grid_points = np.c_[xx.ravel(), yy.ravel()][grid_predictions] = sess.run(prediction, feed_dict={x_data: rand_x, y_target: rand_y, prediction_grid: grid_points})grid_predictions = grid_predictions.reshape(xx.shape)# plot points and gridplt.contourf(xx, yy, grid_predictions, cmap=plt.cm.paired, alpha=0.8)plt.plot(class1_x, class1_y, 'ro', label='i. setosa')plt.plot(class2_x, class2_y, 'kx', label='non setosa')plt.title('gaussian svm results on iris data')plt.xlabel('pedal length')plt.ylabel('sepal width')plt.legend(loc='lower right')plt.ylim([-0.5, 3.0])plt.xlim([3.5, 8.5])plt.show()# plot batch accuracyplt.plot(batch_accuracy, 'k-', label='accuracy')plt.title('batch accuracy')plt.xlabel('generation')plt.ylabel('accuracy')plt.legend(loc='lower right')plt.show()# plot loss over timeplt.plot(loss_vec, 'k-')plt.title('loss per generation')plt.xlabel('generation')plt.ylabel('loss')plt.show() |
输出:
step #75
loss = -110.332
step #150
loss = -222.832
step #225
loss = -335.332
step #300
loss = -447.832
四种不同的gamma值(1,10,25,100):


不同gamma值的山鸢尾花(i.setosa)的分类器结果图,采用高斯核函数的svm。
gamma值越大,每个数据点对分类边界的影响就越大。
以上就是本文的全部内容,希望对大家的学习有所帮助,也希望大家多多支持服务器之家。
原文链接:https://blog.csdn.net/lilongsy/article/details/79414355


