Line plots
|
1
|
Axes3D.plot(xs, ys, *args, **kwargs) |
绘制2D或3D数据
| 参数 | 描述 |
| xs, ys | X轴,Y轴坐标定点 |
| zs | Z值,每一个点的值都是1 |
| zdir | 绘制2D集合时使用z的方向 |
其他的参数:plot()
Python代码:
|
1
2
3
4
5
6
7
8
9
10
11
12
13
14
15
16
17
18
|
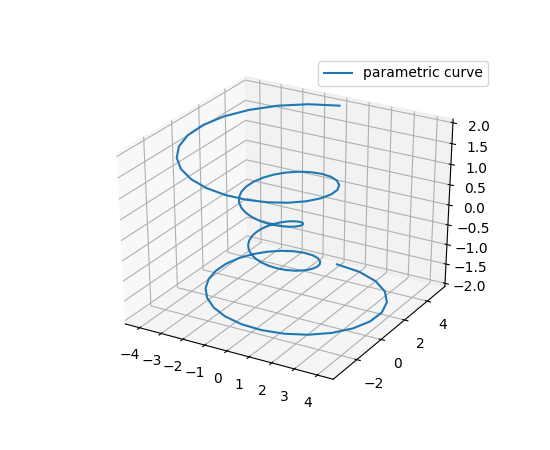
import matplotlib as mplfrom mpl_toolkits.mplot3d import Axes3Dimport numpy as npimport matplotlib.pyplot as pltmpl.rcParams['legend.fontsize'] = 10fig = plt.figure()ax = fig.gca(projection='3d')theta = np.linspace(-4 * np.pi, 4 * np.pi, 100)z = np.linspace(-2, 2, 100)r = z**2 + 1x = r * np.sin(theta)y = r * np.cos(theta)ax.plot(x, y, z, label='parametric curve')ax.legend()plt.show() |
效果图:

总结
以上就是本文关于Python绘制3d螺旋曲线图实例代码的全部内容,希望对大家有所帮助。感兴趣的朋友可以继续参阅本站其他相关专题。本文是从官网摘录下来,参数部分如有描述不当,欢迎大家留言指出。
原文链接:https://matplotlib.org/mpl_toolkits/mplot3d/tutorial.html


