在PHP中,有一些简单的图像函数是可以直接使用的,但大多数要处理的图像,都需要在编译PHP时加上GD库。除了安装GD库之外,在PHP中还可能需要其他的库,这可以根据需要支持哪些图像格式而定。GD库可以在http://www.boutell.com/gd/免费下载,不同的GD版本支持的图像格式不完全一样,最新的GD库版本支持GIF、JPEG、PNG、WBMP、XBM等格式的图像文件,此外还支持一些如FreeType、Type 1等字体库。通过GD库中的函数可以完成各种点、线、几何图形、文本及颜色的操作和处理,也可以创建或读取多种格式的图像文件。
在PHP中,通过GD库处理图像的操作,都是先在内存中处理,操作完成以后再以文件流的方式,输出到浏览器或保存在服务器的磁盘中。创建一个图像应该完成如下所示的4个基本步骤。
(1)创建画布:所有的绘图设计都需要在一个背景图片上完成,而画布实际上就是在内存中开辟的一块临时区域,用于存储图像的信息。以后的图像操作都将基于这个背景画布,该画布的管理就类似于我们在画画时使用的画布。
(2)绘制图像:画布创建完成以后,就可以通过这个画布资源,使用各种画像函数设置图像的颜色、填充画布、画点、线段、各种几何图形,以及向图像中添加文本等。
(3)输出图像:完成整个图像的绘制以后,需要将图像以某种格式保存到服务器指定的文件中,或将图像直接输出到浏览器上显示给用户。但在图像输出之前,一定要使用header()函数发送Content-type通知浏览器,这次发送的是图片不是文本。
(4)释放资源:图像被输出以后,画布中的内容也不再有用。出于节约系统资源的考虑,需要及时清除画布占用的所有内存资源。
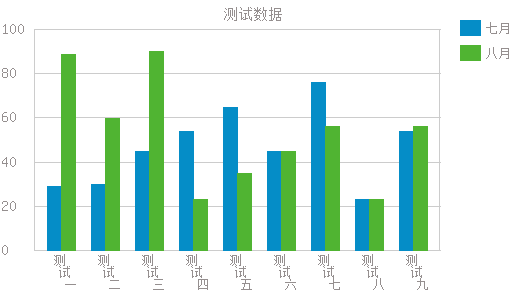
php中用GD绘制折线图,代码如下:
|
1
2
3
4
5
6
7
8
9
10
11
12
13
14
15
16
17
18
19
20
21
22
23
24
25
26
27
28
29
30
31
32
33
34
35
36
37
38
39
40
41
42
43
44
45
46
47
48
49
50
51
52
53
54
55
56
57
58
59
60
61
62
63
64
65
66
67
68
69
70
71
72
73
74
75
76
77
78
79
80
81
82
83
84
85
86
87
88
89
90
91
92
93
94
95
96
97
98
99
100
101
102
103
104
105
106
107
108
109
110
111
112
113
114
115
116
117
118
119
120
121
122
123
124
125
126
127
128
129
130
131
132
133
134
135
136
137
138
139
140
141
142
143
144
145
146
147
148
149
150
151
152
153
154
155
156
157
158
159
160
161
162
163
164
165
166
167
168
169
170
171
172
173
174
175
176
177
178
179
180
181
182
183
184
185
186
187
188
189
190
191
192
193
194
195
196
197
198
199
200
201
202
203
204
205
206
207
208
209
210
211
212
213
214
215
216
217
218
219
220
221
222
223
224
225
226
227
228
|
Class Chart{ private $image; // 定义图像 private $title; // 定义标题 private $ydata; // 定义Y轴数据 private $xdata; // 定义X轴数据 private $seriesName; // 定义每个系列数据的名称 private $color; // 定义条形图颜色 private $bgcolor; // 定义图片背景颜色 private $width; // 定义图片的宽 private $height; // 定义图片的长 /* * 构造函数 * String title 图片标题 * Array xdata 索引数组,X轴数据 * Array ydata 索引数组,数字数组,Y轴数据 * Array series_name 索引数组,数据系列名称 */ function __construct($title,$xdata,$ydata,$seriesName) { $this->title = $title; $this->xdata = $xdata; $this->ydata = $ydata; $this->seriesName = $seriesName; $this->color = array('#DC', '#B', '#EDB', '#DDDF', '#CBE', '#E', '#FF', '#FFF', '#AFC'); } /* * 公有方法,设置条形图的颜色 * Array color 颜色数组,元素取值为'#DC'这种形式 */ function setBarColor($color){ $this->color = $color; } /* * 绘制折线图 */ public function paintLineChart() { $ydataNum = $this->arrayNum($this->ydata); // 取得数据分组的个数 $max = $this->arrayMax($this->ydata); // 取得所有呈现数据的最大值 $max = ($max > )? $max : ; $multi = $max/; // 如果最大数据是大于的则进行缩小处理 $barHeightMulti = .; // 条形高缩放的比例 $lineWidth = ; $chartLeft = (+strlen($max))*; // 设置图片左边的margin $lineY = ; // 初始化条形图的Y的坐标 // 设置图片的宽、高 //$this->width = $lineWidth*count($this->xdata) + $chartLeft - $lineWidth/.; $margin = ; // 小矩形描述右边margin $recWidth = ; // 小矩形的宽 $recHeight = ; // 小矩形的高 $space = ; // 小矩形与条形图的间距 $tmpWidth = ; // 设置图片的宽、高 $lineChartWidth = $lineWidth*count($this->xdata) + $chartLeft - $lineWidth/. ; // 两个系列数据以上的加上小矩形的宽 if($ydataNum > ) { $tmpWidth = $this->arrayLengthMax($this->seriesName)**/ + $space + $recWidth + + $margin; } $this->width = $lineChartWidth + $tmpWidth; $this->height = ; $this->image = imagecreatetruecolor($this->width ,$this->height); // 准备画布 $this->bgcolor = imagecolorallocate($this->image,,,); // 图片的背景颜色 // 设置条形图的颜色 $color = array(); foreach($this->color as $col) { $col = substr($col,,strlen($col)-); $red = hexdec(substr($col,,)); $green = hexdec(substr($col,,)); $blue = hexdec(substr($col,,)); $color[] = imagecolorallocate($this->image ,$red, $green, $blue); } // 设置线段的颜色、字体的颜色、字体的路径 $lineColor = imagecolorallocate($this->image ,xcc,xcc,xcc); $fontColor = imagecolorallocate($this->image, x,xf,xf); $fontPath = 'font/simsun.ttc'; imagefill($this->image,,,$this->bgcolor); // 绘画背景 // 绘画图的分短线与左右边线 for($i = ; $i < ; $i++ ) { imageline($this->image,$chartLeft-,$lineY-$barHeightMulti*$max//$multi*$i,$lineChartWidth,$lineY-$barHeightMulti*$max//$multi*$i,$lineColor); imagestring($this->image,,,$lineY-$barHeightMulti*$max//$multi*$i-,floor($max/*$i),$fontColor); } imageline($this->image,$chartLeft-,,$chartLeft-,$lineY,$lineColor); imageline($this->image,$lineChartWidth-,,$lineChartWidth-,$lineY,$lineColor); $style = array($lineColor,$lineColor,$lineColor,$lineColor,$lineColor,$this->bgcolor,$this->bgcolor,$this->bgcolor,$this->bgcolor,$this->bgcolor); imagesetstyle($this->image,$style); // 绘制折线图的分隔线(虚线) foreach($this->xdata as $key => $val) { $lineX = $chartLeft + + $lineWidth*$key; imageline($this->image,$lineX,,$lineX,$lineY,IMG_COLOR_STYLED); } // 绘画图的折线 foreach($this->ydata as $key => $val) { if($ydataNum == ) { // 一个系列数据时 if($key == count($this->ydata) - ) break; $lineX = $chartLeft + + $lineWidth*$key; $lineY = $lineY-$barHeightMulti*($this->ydata[$key+])/$multi; // 画折线 if($key == count($this->ydata) - ) { imagefilledellipse($this->image,$lineX+$lineWidth,$lineY,,,$color[]); } imageline($this->image,$lineX,$lineY-$barHeightMulti*$val/$multi,$lineX+$lineWidth,$lineY,$color[]); imagefilledellipse($this->image,$lineX,$lineY-$barHeightMulti*$val/$multi,,,$color[]); }elseif($ydataNum > ) { // 多个系列的数据时 foreach($val as $ckey => $cval) { if($ckey == count($val) - ) break; $lineX = $chartLeft + + $lineWidth*$ckey; $lineY = $lineY-$barHeightMulti*($val[$ckey+])/$multi; // 画折线 if($ckey == count($val) - ) { imagefilledellipse($this->image,$lineX+$lineWidth,$lineY,,,$color[$key%count($this->color)]); } imageline($this->image,$lineX,$lineY-$barHeightMulti*$cval/$multi,$lineX+$lineWidth,$lineY,$color[$key%count($this->color)]); imagefilledellipse($this->image,$lineX,$lineY-$barHeightMulti*$cval/$multi,,,$color[$key%count($this->color)]); } } } // 绘画条形图的x坐标的值 foreach($this->xdata as $key => $val) { $lineX = $chartLeft + $lineWidth*$key + $lineWidth/ - ; imagettftext($this->image,,-,$lineX,$lineY+,$fontColor,$fontPath,$this->xdata[$key]); } // 两个系列数据以上时绘制小矩形及之后文字说明 if($ydataNum > ) { $x = $lineChartWidth + $space; $y = ; foreach($this->seriesName as $key => $val) { imagefilledrectangle($this->image,$x,$y,$x+$recWidth,$y+$recHeight,$color[$key%count($this->color)]); imagettftext($this->image,,,$x+$recWidth+,$y+$recHeight-,$fontColor,$fontPath,$this->seriesName[$key]); $y += $recHeight + ; } } // 绘画标题 $titleStart = ($this->width - .*strlen($this->title))/; imagettftext($this->image,,,$titleStart,,$fontColor,$fontPath,$this->title); // 输出图片 header("Content-Type:image/png"); imagepng ( $this->image ); } /* * 私有方法,当数组为二元数组时,统计数组的长度 * Array arr 要做统计的数组 */ private function arrayNum($arr) { $num = ; if(is_array($arr)) { $num++; for($i = ; $i < count($arr); $i++){ if(is_array($arr[$i])) { $num = count($arr); break; } } } return $num; } /* * 私有方法,计算数组的深度 * Array arr 数组 */ private function arrayDepth($arr) { $num = ; if(is_array($arr)) { $num++; for($i = ; $i < count($arr); $i++){ if(is_array($arr[$i])) { $num += $this->arrayDepth($arr[$i]); break; } } } return $num; } /* * 私有方法,找到一组中的最大值 * Array arr 数字数组 */ private function arrayMax($arr) { $depth = $this->arrayDepth($arr); $max = ; if($depth == ) { rsort($arr); $max = $arr[]; }elseif($depth > ) { foreach($arr as $val) { if(is_array($val)) { if($this->arrayMax($val) > $max) { $max = $this->arrayMax($val); } }else{ if($val > $max){ $max = $val; } } } } return $max; } /* * 私有方法,求数组的平均值 * Array arr 数字数组 */ function arrayAver($arr) { $aver = array(); foreach($arr as $val) { if(is_array($val)) { $aver = array_merge($aver,$val); }else{ $aver[] = $val; } } return array_sum($aver)/count($aver); } /* * 私有方法,求数组中元素长度最大的值 * Array arr 字符串数组,必须是汉字 */ private function arrayLengthMax($arr) { $length = ; foreach($arr as $val) { $length = strlen($val) > $length ? strlen($val) : $length; } return $length/; } // 析构函数 function __destruct(){ imagedestroy($this->image); } } |
测试代码如下:
|
1
2
3
4
5
6
7
|
$xdata = array('测试一','测试二','测试三','测试四','测试五','测试六','测试七','测试八','测试九');$ydata = array(array(,,,,,,,,),array(,,,,,,,,));$color = array();$seriesName = array("七月","八月");$title = "测试数据";$Img = new Chart($title,$xdata,$ydata,$seriesName);$Img->paintLineChart(); |
效果图如下:

到此代码结束。
下面给大家介绍php中GD库的一些简单使用
今天了解了一些GD库的简单使用,现在稍微做一下总结!
GD库是什么?,graphic device,图像工具库,gd库是php处理图形的扩展库,gd库提供了一系列用来处理图片的API,使用GD库可以处理图片,或者生成图片。 在网站上 GD库通常用来生成缩略图或者用来对图片加水印或者对网站数据生成报表。
php并不局限于输出HTML文本。php通过使用GD扩展库还能用来动态输出图像,例如文字按钮、验证码、数据统计图等。哈可以轻松地编辑图像,力图处理缩略图和为图片添加水印等,具有强大的图像处理能力。
首先我们来说下GD库,绘制个简单图形的一些步骤:
1、首先是创建画布,此处我们利用imagecreatetruecolor函数,也可以利用imagecreate,区别在于前者创建了一个真彩图像,后者创建了一个基于调色板的图像
$img=imagecreatetruecolor(100,100),其中有两个参数分别对应,我们创建的图像的宽和高
2、设置一些必要的"染料盒"
其实就是定义一些之后会用到的填充颜色,此处我们统一定义在这个位置,此处我们利用imagecolorallocate函数
|
1
2
3
4
5
6
7
8
9
|
$white=imagecolorallocate($img,0xFF,0xFF,0xFF)或者可以使用RGB的颜色命名方式 如$white=imagecolorallocate($img,255,255,255);$gray = imagecolorallocate($img, 0xC0, 0xC0, 0xC0);$darkgray = imagecolorallocate($img, 0x90, 0x90, 0x90);$navy = imagecolorallocate($img, 0x00, 0x00, 0x80);$darknavy = imagecolorallocate($img, 0x00, 0x00, 0x50);$red = imagecolorallocate($img, 0xFF, 0x00, 0x00);$darkred = imagecolorallocate($img, 0x90, 0x00, 0x00);$black=imagecolorallocate($img,0x00,0x00,0x00); |
此处我们定义多一些所需要的颜色
3、填充区域颜色,可以简单的理解为填充图片的背景颜色,利用imagefill函数
imagefill($img,0,0,$white),此处的0 0表示从坐标x y处开始填充背景色
4、绘制图形,例如绘制饼状图,所需要的是imagefilledarc函数
imagefilledarc()的参数相对来说较多,形如imagefilledarc($img,50,$i,100,50,0,45,$red,IMG_ARC_PIE);
其中分别表示以red颜色字img图像上绘制一个以50,$i为起点,以0 45角度这个范围内绘制弧线
5、期间我们还可以添加一些说明问题,比如水平的添加一个字符串,利用 imagestring($img,1,20,40,"hello,world!",$red),表示在img图片中以20 40为坐标,写上一个红色的hello,world!字样
6、就是讲图像输出
首先要告之浏览器要以何种图片格式输出,例如以png输出,则使用header("Content-type:image/png");
其次 将图片输出到浏览器中,imagepng($img);
最后,销毁图片,即释放该图片存储所占用的内存 imagedestroy(img);,


